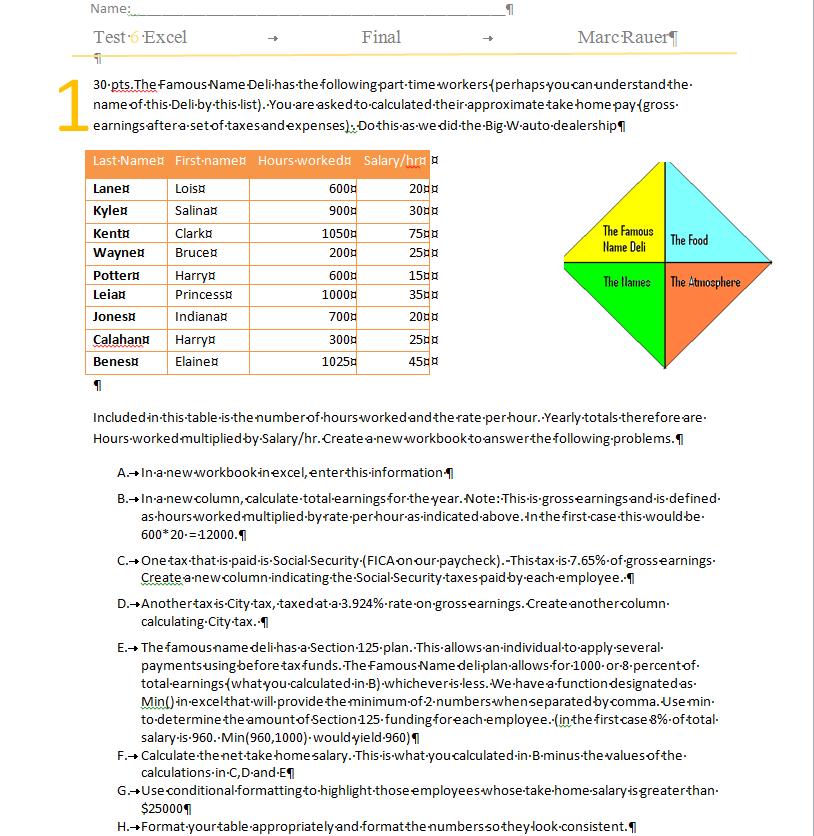
As we have found out today, reality can sometimes intervene on events. For those of you who did make it to class - only to find out that it was cancelled - my apologies. You should understand that I too attempted to make it to my early session but after a mile and a half, it was obvious that this was not going to work.
So, I have to consider what we should do about the excel test? Read the following carefully as it slightly modifies what is in your syllabus.
The Excel test is the sixth marking event of the course. Five have already been taken worth 65 points. Your excel test is worth 35 points per the syllabus. Some of you have missed tests already and in informal discussions with you, I said that if you missed the library or powerpoint assignment, I would probably normalize the grade to ignore your missed marking event. For example, the powerpoint project was worth 9 points so if you missed it, I would mark you on 91 points, as if it was 100, as to your range of assignments. This is mathematically what we call normalized by multiplying everything by 100/91.
What was the limitations: If you missed both, I would ignore the lowest valued grade and give a zero for the other. In addition, the automatic 3 point extra credit indicated in the syllabus for all those taking all the tests on time would not be available in the case of you missing the library or powerpoint marking events.
Also keep in mind that this does not apply to any Word or Access marking events. Those missed will still be graded as a zero.
Here's what I propose: I have below set up jnumbers so that you can do your excel test similar to what we did with Access. Also similar to access are multiple tests that I have created for Excel. Your Jnumber is keyed to giving you one of these tests. If you take this exam, you have until 12PM (noon) on Friday to submit it. I had set my schedule to mark your tests tomorrow (wednesday) and given what has happened I have today rearranged my schedule so that I am free on Friday afternnon. Grades must be in by the end of Dec 16th so I cannot grade tests returned after noon on Friday.
However, I am adding the excel test to the optional tests of Library and Powerpoint. If this is the only test missed, you will be marked on the basis of 65 points and normalized as exampled above. Those who have missed prior tests must take this test or the grade that you will receive for excel will be a zero. In addition, non submission of this test to me by the appointed time precludes the extra three points if you were still eligible. I think this is fair and reasonable given the circumstances.
Here are the files used for all the excel tests:
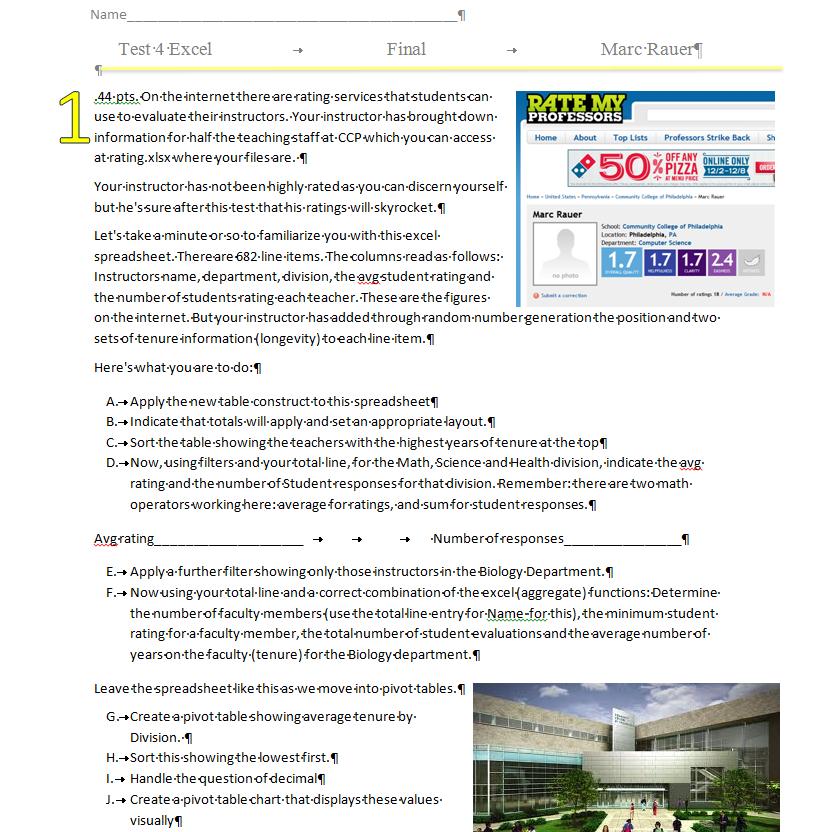
ratingThere are three problems for all the tests. You will be submitting three excel worksheets. In addition, there are several written answers. If done in class I was going to recollect the handed out tests. Since the Word document representing the test has been sent to you as a link, answer the written portion of the test in Word and send me the test document with your excel files.
Below is your Jnumber. Click to access the test. If for some reason your Jnumber is missing or you can't access the test, contact me immediately and as soon as possible I will send you everything by Email.
J00039733I can't make the morning class for finals. We made it a mile and a half and then had to turn back. I suspect that the afternoon class will have the same problem. So, my thinking is to set this up as a takehome with me Emailing you the final and the files. Stay tuned!
There are two scheduledfianl exams tomorrow. The first is at 9:30 at Room 114 at Northwest. The second is at 2:30 in Rm C3-18 at the CBI building.
Here's how I run my finals: We should start at 9:30 or 2:30 (assuming your instructor is there and we hope to be) and it will take about 10 minutes or so to distribute the tests and have a few words. ONce started, I allow anywhere between 2 and 2 and a quarter hours for the test. You are Emailing me your answers and at a certain point I will Email myself indicating that further Emails will not count.
The long and short of this is as follows: Come when you want but the test for all ends at a specific time.
I expect 6 tests to be in operation. Below we show these:
These tests all contain 3 excel problems. One is similar to the Big W auto dealership in that the student has to enter the data. The other two questions use excel spreadsheets which will be made available during the test.
Excel counts 35% of your grade - please see the syllabus. Anyone not taking the exam gets a zero. Grades are scheduled to be set by Dec 16th although I will have them submitted before that.
What are you allowed at the test: my web site and its notes, your notes, your book and its web sites, your notes. You are not allowed to use your neighbor. Any suspicion of you submitting other's work will lead to zeros for the test for all involved.
Bring a pen or pencil as there are several questions you will fill out on the test paper itself. The test must be returned to me at the end of the testing period given that I will be marking these written answers.
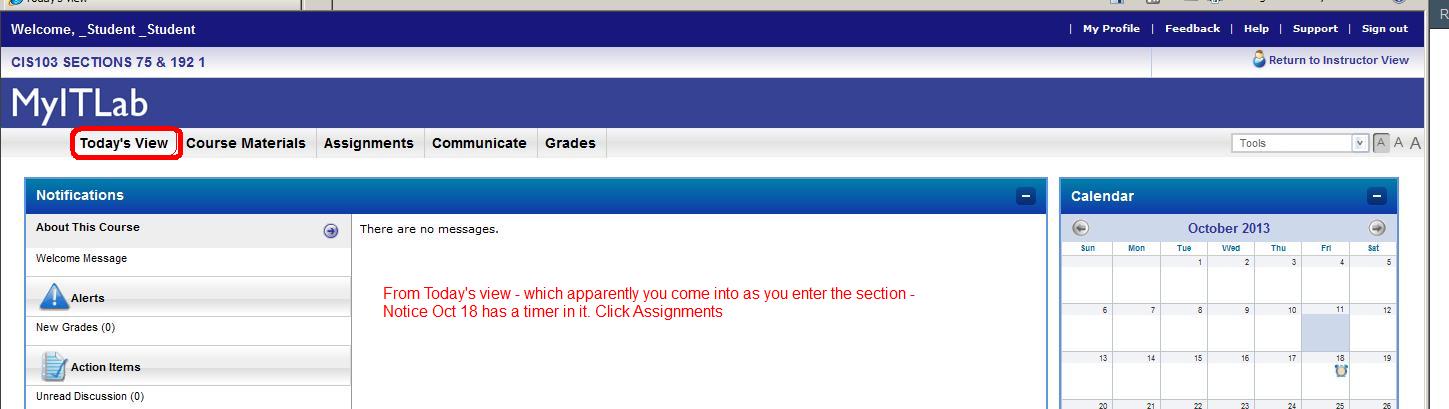
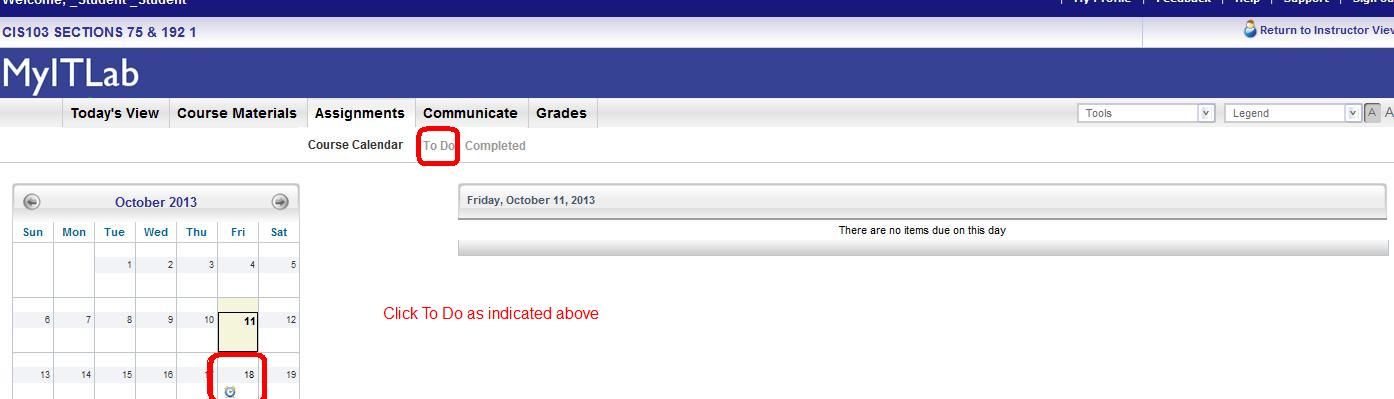
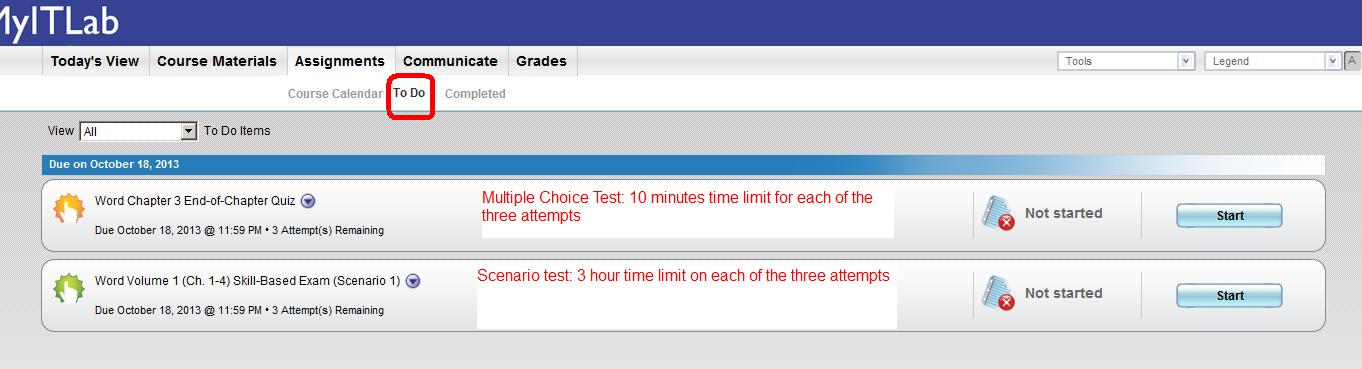
As of 6:45AM 10/11/13., I have looked at the myitlab website. I expect to get more into this later today after my medical procedure by the following three screen images will guide you to the tests:
As of Nov 24th, the access assignments were due. Below is a table by Jnumber indicating your grades per question (there were 7 things to do). Your access test is a 20% componebt of your grade and those not submitting a test receive a zero for this.
Jnumber		q1	q2	q3	q4	q5	q6	q7	tot	Grade	Notes
J00039733	1	1	1	0	0.5	1	1	15.5	77.5	did not do q4;no sum of pop in q5
J00041467	1	0.5	1	1	0	1	1	15.5	77.5	Did not indicate counties in q2 and did not do q5
J00044362								0	0	Not submitted
J00047921	1	0	1	1	0.5	0.75	0	11.75	58.75	q2 and q7 were in essence not submitted. Forgot one county in q6. Did not use sum in q5
J00059010	0.5	1	1	1	1	1	0	16	80	q1:did not do us pop; did not submit q7
J00059345	0	0	1	0	0	0	0	3	15	Very Wrong
J00064868	1	1	1	1	1	0	1	17	85	q6 did not have county info in it
J00070107	1	1	1	1	0.5	1	1	18.5	92.5	q5 not summed
J00081761	0.25	0.5	1	0	0	0	0	5	25	In Q1 did not sum. In Q2 did not disply county
J00085531								0	0	Not submitted
J00091097								0	0	Not submitted
J00091952								0	0	Not submitted
J00094388	1	1	1	1	1	0	1	17	85	Q6 not done
J00101458								0	0	Not Submitted
J00101876								0	0	Not submitted
J00110007	1	1	1	1	1	1	0.5	18.5	92.5	q7 did not sum the counties
J00110035	1	0.5	1	1	0.5	1	1	17	85	in q2 did not include county. No sum in q5
J00112838	0.25	0.5	0	0	0	0	0	2	10	In essence all wrong
J00115799	1	1	1	1	1	0	0.5	15.5	77.5	q6 not done;q7 messed up ors
J00118092								0	0	Not submitted
J00119253	1	1	1	1	1	1	1	20	100	perfect
J00127824	1	1	1	1	1	0	1	17	85	q6 not submitted
J00132570	1	0.5	1	1	0.25	1	0.5	14.75	73.75	q2 didn't indicate county name:Q5 no sum per state:q7 wrong number
J00133910	1	1	1	0	0.5	0.75	0	11.75	58.75	q7 did not make provision for state;q4 not done;q5 did not sum population
J00135307	1	1	1	1	0.75	1	0.5	17.75	88.75	q5 not summed;q7 not a sum
J00140929	1	0	1	0	0	0	0	5	25	Very Wrong
J00141658	1	1	1	1	1	1	1	20	100	perfect
J00141861	1	1	1	0	1	1	0	14	70	Did not do q4 or q7
J00143168	1	1	1	1	0.25	0.5		13.25	66.25	q7 not done:q5 and q6 not linked to second table
J00143706	1	1	1	1	1	0.75	0	16.25	81.25	q7 not done. Q6 does not include state so duplicates
J00144450	1	0.5	1	0	1	0.5	0	11	55	Incorrect joins. Did not do q4 determining by query derivation
J00144671	1	1	1	1	1	1	1	20	100	perfect
J00146793								0	0	Not submitted
J00147234	1	0	1	0	0	0	0	5	25	don't know what q2 is
J00148452								0	0	Not Submitted
J00148603	1	1	1	1	1	0	1	17	85	q6 not submitted
J00150423	0.5	1	1	1	1	1	1	19	95	Q1:did not sum population
J00150659	1	1	0.25	1	1	0	1	14.75	73.75	q3 linked not imported;q6 not done
J00157458	1	1	1	1	0.25	1	0	14.75	73.75	q7 not done. Q5 has wrong link
J00157809	1	1	1	1	1	1	1	20	100	perfect
J00161830								0	0	Not submitted
J00162999	1	1	1	1	1	1	1	20	100	Perfect
J00165882	1	1	1	1	1	1	1	20	100	perfect
J00166241	1	1	1	1	0.5	1	0	15.5	77.5	q5 not summed per state;q7 not done
J00166682								0	0	Not submitted
J00167591	1	1	1	1	1	0	1	17	85	q6 did not include the question of counties
J00173154	1	1	1	1	1	1	1	20	100	perfect
J00173245								0	0	Not submitted
J00173311	1	0.25	1	1	0.5	1	1	16.25	81.25	q2 not using any state;q5 not summed
J00175384								0	0	Not submitted
J00179387	1	0.5	1	0	0	0	0	6.5	32.5	Q2 included all 50 states
J00179612	1	0.5	1	0	1	0.5	0	11	55	Did not use state in q2. did not do q4 or q7. Had a wrong join in q6
J00181742								0	0	Not submitted
J00186059	1	1	1	1	1	1	1	20	100	Perfect
J00187265	1	1	1	1	1	1	0.5	18.5	92.5	q7 not summed
J00191207								0	0	Not submitted
J00692004	1	0	1	1	1	1	0.5	15.5	77.5	q7 has no sum;q2 in essence wasn't done
J00813339	1	0	1	1	0.5	1	0.5	14	70	In essence did not submit q2. Others didn't do sum correctly
J00854495								0	0	Not Submitted
J00875169								0	0	Not submitted
J00877632								0	0	Not submitted
J01014661								0	0	Not Submitted
J01130945	1	1	1	1	1	1	0.5	18.5	92.5	Messed up or statement in q7
J01146384	1	1	1	1	0	1	0.5	15.5	77.5	q7 has no sum. Wrong on q5
J01170646	1	0	1	1	0.25	1	0	11.75	58.75	q2 and q7 not done. Q5 did not link the right tables
J01265893	1	0.25	0	0	0	0	0	2.75	13.75	in essence not doing q3 through q7
J01298430	1	1	1	1	1	1	1	20	100	Perfect
J01303656	1	1	1	1	1	1	1	20	100	perfect
J01338816	1	1	1	1	1	1	1	20	100	perfect
J01361224	1	1	1	0	0.5	1	1	15.5	77.5	didn't sum in q5. Did not specifically find section
J01369187	1	1	1	1	1	1	1	20	100	Perfect
This is the grades including the Access test. Next week we have the excel test worth 35% of the course..
ID	Lib MK	Word Multi	Word scenario	powerpoint	Access test result	Access test normal	Comments
J00039733	2	0	50	Y	15.5	77.5	did not do q4;no sum of pop in q5
J00041467	3	100	76.5	Y	15.5	77.5	Did not indicate counties in q2 and did not do q5
J00044362	4	0	0		0	0	Not submitted
J00046761	0	0	0		0	0	0
J00047921	3	100	91.2		11.75	58.75	q2 and q7 were in essence not submitted. Forgot one county in q6. Did not use sum in q5
J00059010	6	85	70.6	Y	16	80	q1:did not do us pop; did not submit q7
J00059345	5	95	50	Y	3	15	Very Wrong
J00064868	0	100	82.4	Y	17	85	q6 did not have county info in it
J00070107	1	90	79.4	Y	18.5	92.5	q5 not summed
J00081761	4	100	94.1	Y	5	25	In Q1 did not sum. In Q2 did not disply county
J00085531	0	did not enroll	did not enroll		0	0	Not submitted
J00091097	3	95	29.4	Y	0	0	Not submitted
J00091952	5	did not enroll	did not enroll		0	0	Not submitted
J00094388	4	100	97.1	Y	17	85	Q6 not done
J00101458	0	did not enroll	did not enroll		0	0	Not Submitted
J00101876	5	100	0	Y	0	0	Not submitted
J00110007	5	80	58.8	Y	18.5	92.5	q7 did not sum the counties
J00110035	2	100	97.1		17	85	in q2 did not include county. No sum in q5
J00112838	4	did not enroll	did not enroll	Y	2	10	In essence all wrong
J00115799	3	100	55.9	Y	15.5	77.5	q6 not done;q7 messed up ors
J00118092	3	100	85.3	Y	0	0	Not submitted
J00119253	3	100	97.1	Y	20	100	perfect
J00127824	5	100	94.1	Y	17	85	q6 not submitted
J00132570	6	90	70.6	Y	14.75	73.75	q2 didn't indicate county name:Q5 no sum per state:q7 wrong number
J00133910	4	85	67.7	Y	11.75	58.75	q7 did not make provision for state;q4 not done;q5 did not sum population
J00135307	2	90	85.3	Y	17.75	88.75	q5 not summed;q7 not a sum
J00140929	4	100	97.1	Y	5	25	Very Wrong
J00141658	3	100	100	Y	20	100	perfect
J00141861	4	90	73.5	Y	14	70	Did not do q4 or q7
J00143168	6	75	85.3		13.25	66.25	q7 not done:q5 and q6 not linked to second table
J00143706	4	100	79.4	Y	16.25	81.25	q7 not done. Q6 does not include state so duplicates
J00144450	2	95	76.5	Y	11	55	Incorrect joins. Did not do q4 determining by query derivation
J00144671	5	100	73.5	Y	20	100	perfect
J00146793	1	100	94.1	Y	0	0	Not submitted
J00147234	3	100	97.1	Y	5	25	don't know what q2 is
J00148452	0	did not enroll	did not enroll		0	0	Not Submitted
J00148603	5	90	61.8		17	85	q6 not submitted
J00150423	5	100	97.1	Y	19	95	Q1:did not sum population
J00150659	3	50	91.2	Y	14.75	73.75	q3 linked not imported;q6 not done
J00157458	3	0	5.9	Y	14.75	73.75	q7 not done. Q5 has wrong link
J00157809	3	100	73.5	Y	20	100	perfect
J00161830	3	did not enroll	did not enroll		0	0	Not submitted
J00162999	4	100	100	Y	20	100	Perfect
J00165882	5	100	97.1	Y	20	100	perfect
J00166241	5	75	88.2	Y	15.5	77.5	q5 not summed per state;q7 not done
J00166682	0	did not enroll	did not enroll		0	0	Not submitted
J00167591	0	100	82.4	Y	17	85	q6 did not include the question of counties
J00173154	0	0	88.2	Y	20	100	perfect
J00173245	0	0	35.3		0	0	Not submitted
J00173311	3	80	88.2	Y	16.25	81.25	q2 not using any state;q5 not summed
J00175384	3	75	70.6	Y	0	0	Not submitted
J00179387	3	100	82.4	Y	6.5	32.5	Q2 included all 50 states
J00179612	3	90	82.4	Y	11	55	Did not use state in q2. did not do q4 or q7. Had a wrong join in q6
J00181742	4	100	76.5	Y	0	0	Not submitted
J00186059	4	100	88.2	Y	20	100	Perfect
J00187265	3	100	70.6	Y	18.5	92.5	q7 not summed
J00191207	6	100	94.1	Y	0	0	Not submitted
J00692004	2	85	73.5	Y	15.5	77.5	q7 has no sum;q2 in essence wasn't done
J00813339	6	95	52.9	Y	14	70	In essence did not submit q2. Others didn't do sum correctly
J00854495	6	0	0		0	0	Not Submitted
J00875169	6	did not enroll	did not enroll		0	0	Not submitted
J00877632	0	did not enroll	did not enroll		0	0	Not submitted
J01014661	5	85	61.8		0	0	Not Submitted
J01130945	4	100	70.6	Y	18.5	92.5	Messed up or statement in q7
J01146384	5	95	88.2	Y	15.5	77.5	q7 has no sum. Wrong on q5
J01170646	5	100	70.6		11.75	58.75	q2 and q7 not done. Q5 did not link the right tables
J01265893	5	95	88.2	Y	2.75	13.75	in essence not doing q3 through q7
J01298430	6	95	97.1	Y	20	100	Perfect
J01303656	4	100	100	Y	20	100	perfect
J01338816	4	100	85.3	Y	20	100	perfect
J01361224	4	100	88.2	Y	15.5	77.5	didn't sum in q5. Did not specifically find section
J01369187	4	95	76.5	Y	20	100	Perfect
Your Access test is ready. Below you should be able to find your Jnumber and in clicking, you will be loading a Word document that explains the test.
ID j000000You are required to attend class whether on tuition assistance or not. Whether you know the subject or not. Failure to attend the required amount of classes may result in a drop from the class. The instructor is required to indicate attendance to the school through various reports. For those on Financial aid: if your aid is dependent on attendance, make sure you attend. If you don't attend (or if very late) and you are dropped, this is your problem.
You are expected to be on time and attend each class till it ends. Excessive lateness or early leaving will be noted and may be considered as absences.
Tests are assigned with an end date indicated. You are expected to take each test before the end time. Failure to do so will involve some type of penalty. No tests (or class assignments) will be =========================================================================================================================== 8rtf[=]accepted after the instructor has submitted his final grades to the school.
Books are assigned. Our book will be mentioned later. You are expected to buy the book during the first week. This is regardless of tuition credit or reinbursement issues.
The instructor is not responsible for protecting your tuition assistance. You will receive the grade earned for the class. If there is a need for a certain mark per your aid, make sure you earn the grade needed.
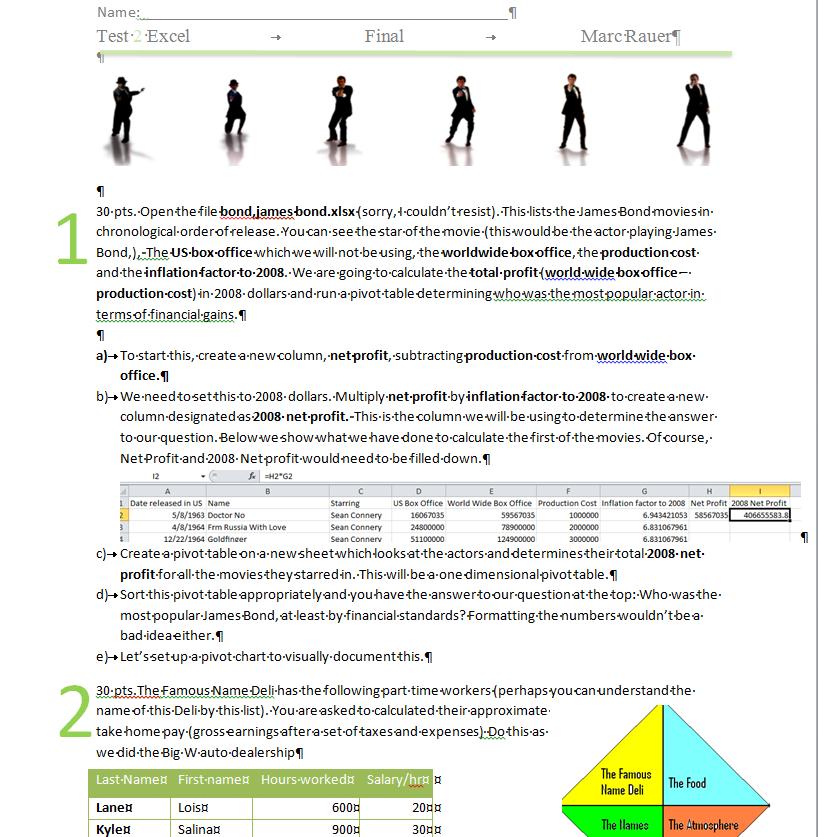
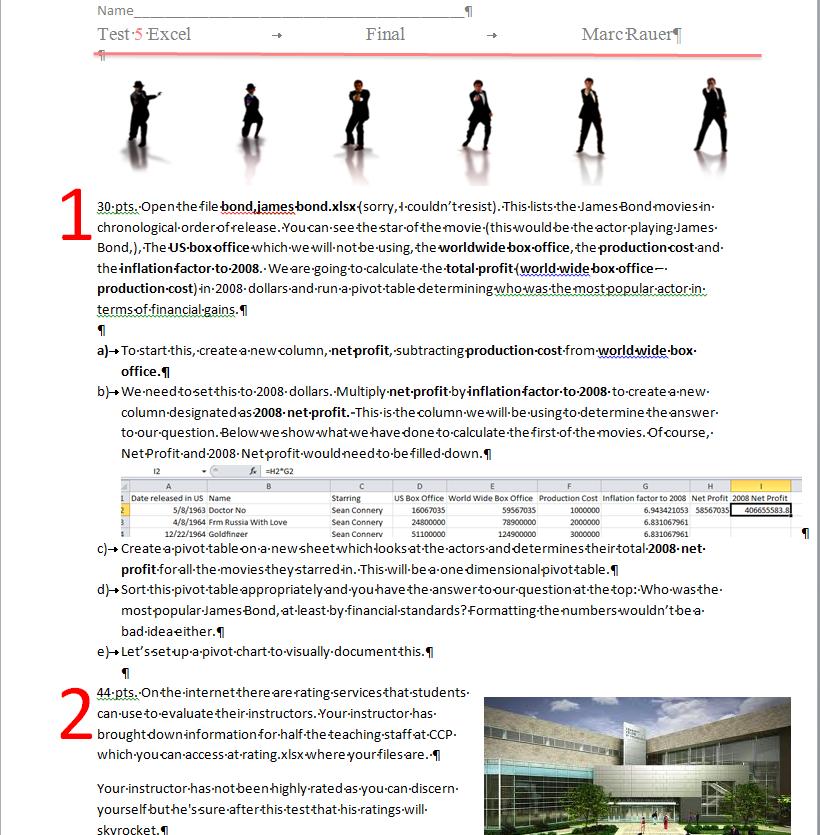
This week we end our class and our discussions of excel. We will be doing two problems: the books of Ian Fleming and the CBL. let's deal with the fleming books first. click here.
Below we show what we intend to do with the this problem from creating an excel spreadsheet to the use of a two dimentional pivot table
Below is the description from previous classes and you are welcome to study this as you get ready for the test.
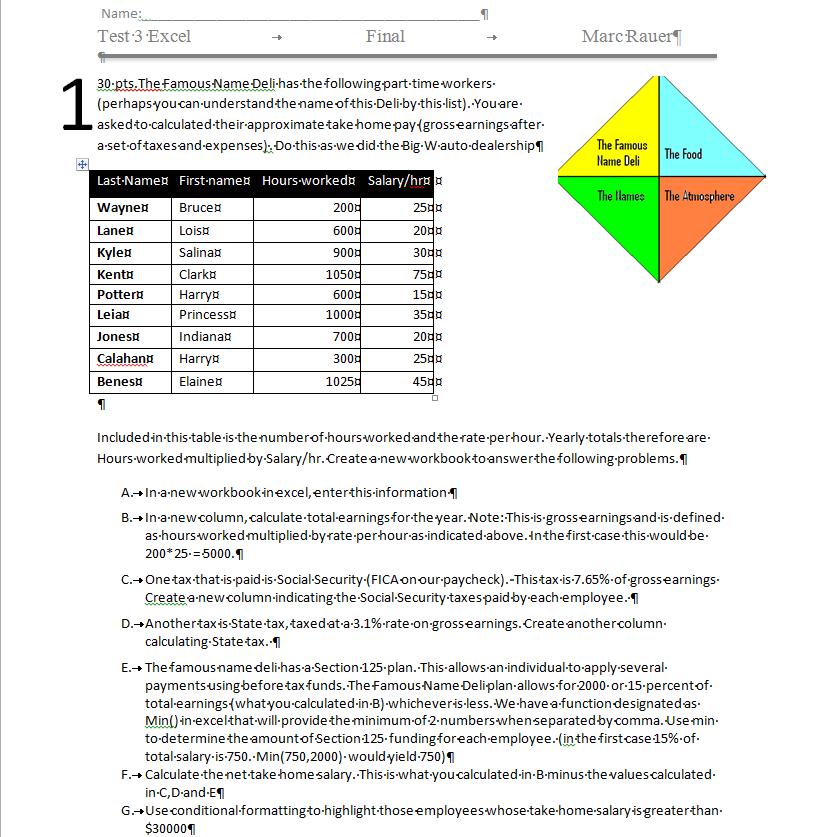
For today, we want to do another problem designated as the CBL. You can read some ducumentation about this problem by clicking here. You can access the file for processing by click here.. The CBL problem is as such: Each statistic represents a portion of MVP points. A single is worth one pt, double is worth 2, triple 3, home run 4. Each walk is .75. Steals and sacrifices are .5. Each error is a negative 3 (-3). Calculate the MVP points for each player. The player with the most points is the league MVP. Who is it? The team with the best average MVP points is the league champion. Break down this info by bats Left and right. This will be our last problem of the class.
For Nov 26, we will finish the problem started last week. Click here for the excel spreadsheet as we ended the session last week. I think our lecture will go as follows:
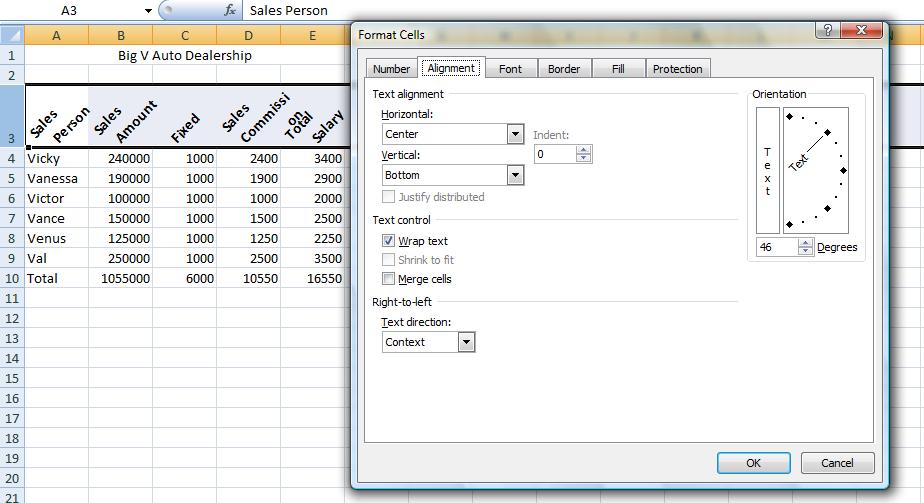
Click on format cells and you will se a dialog box pertaining to 6 possibilities for the range selected. One, protection, we will not deal with. Font generally can be dealt with using the font group of the home tab of the ribbon. Even number, which is very important, can be dealt with through the number group of the home tab. But alignment still holds importance and we want to click this. Notice there is a check box, merge cells, and in essence this was used to create the title in Row 1 although it is easier to control through the icon we used.
There are two combo boxes which control the type of formatting on a vertical and horizontal level. To start out, use center and center and click the wrap text check box. This is the most important of the control although you would not know it by the placement. Below we show a compoasite of these selections and the result.
Fixed really should be at the bottom and this would have occurred if the vertical controls were set to bottom. Further, you might want to set this text at an angle and the picture below shows this using a 45 degree angle.
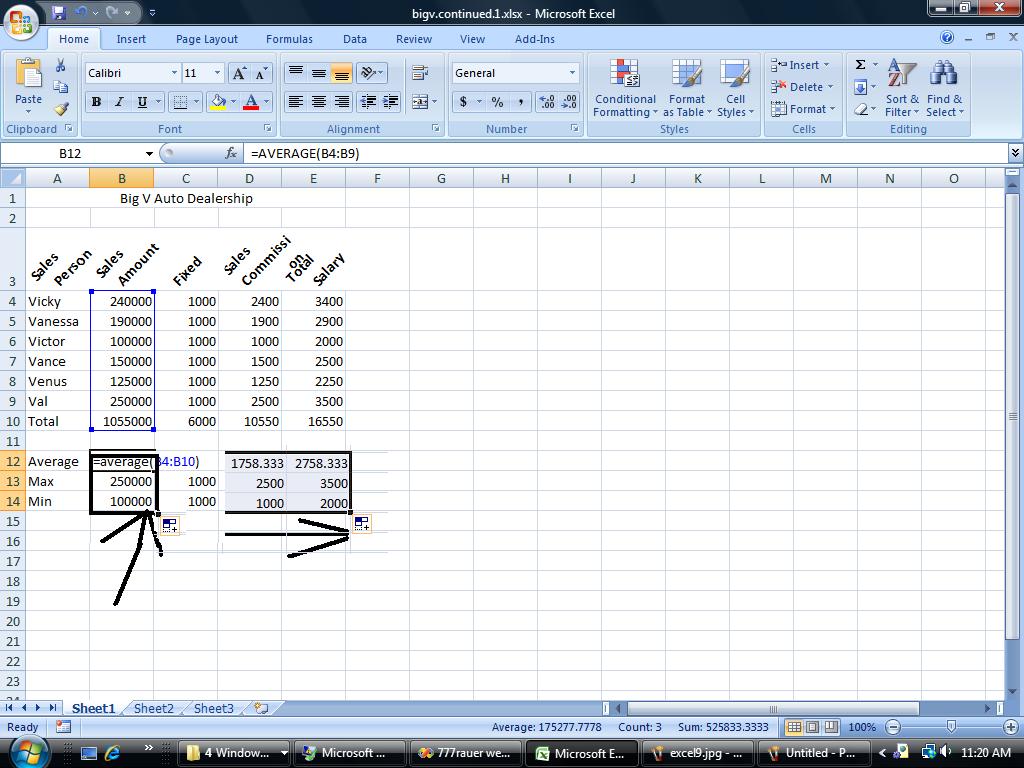
If you want, you can set this back. We now want to set up 3 rows below this table indicating for each column, max, min and average. Our table stretches to row 10 so let's use row 12 to start this. To get an averagbe, indicate a range in the =average() function. Likewise for max using =max() and min using =min(). So in B12, set the function =average(range) where range is B4 through B9. Why not use B10?
Similarly, in B13, set up the max and in B14, set up the min. Similar to our totals, these are relationships that can be copied over. But you do not have to do this a row at a time. Excel is smart enough to fill up ranges. Select the range B12 though B14 and then grab the handle and copy over. See how easy this is! Below is a composite of this.
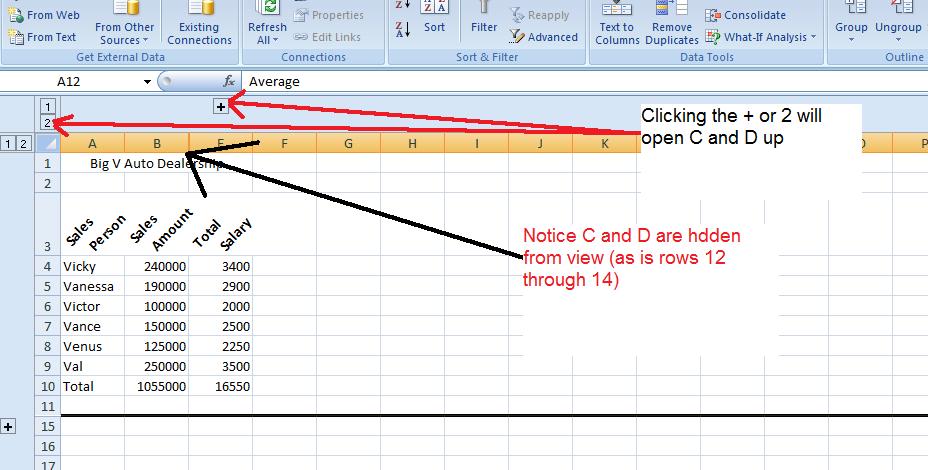
We have our spreadsheet and then some. Suppose we would like to prepare it for a few viewers. But the needs are different for any of them. There is the owner who wants to know what amount was sold and what the salaries were. There is the accountant who need to see all numbers. To resolve this, Excel provides from grouping which on the operating system is called un Or decompress and compress. Here we have group and ungrouping of rows and columns. This is done on a specific entire row or column basis. Group and ungroup is found on the data tab of the ribbon.
Let's start this looking at columns C &D - fixed and variable. The big boss is probably not interested in this so highlight the entire column c and the entire column D by clicking insider the descriptor headings of c and D. Now, click group on the data menu. A new section opens up with new controls. Use of the controls (both to the left and above the columns) allows you to compress C & D from view or make them visibile. Similarly, let's do the same for rows 12, 13 & 14. hen compressed, by the way. a printout will not showe these columns and/or rows so this works even when printing. Below is an example of this.
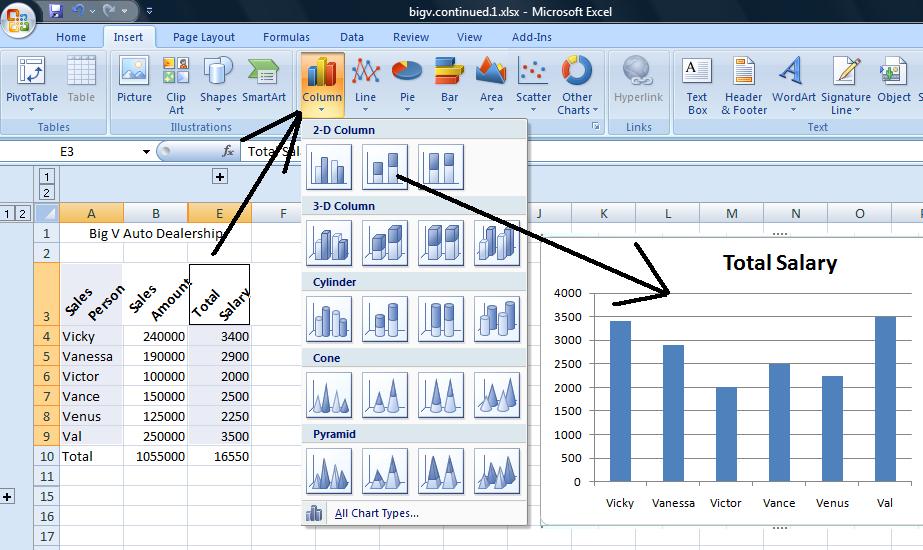
A graph or chart might look good here. Let's reference the sames person's name and show their salary. What type of chart would work to do this. Probably a bar/column chart. Microsoft calls that we woud normally call a Bar chart, a column chart. For this class bar abd column is interchangeable and you can do either when asked to do a bar chart.
Over the years, excel has made it easier and quicker to invoke a chart. Here's how easy it is. Drag you mouse over the names of the sales people including the column header, Sales person. Do not include total info. You have selected a range, A3 through A9. Now, depressing your control key, extend the range by dragging your mouse over the salaries. Again include the column header by do not include the total. This is the extended range I alluded to previously and it is only with this type of charting that we will support it. Now, at the moment, A3 through and E3 through E9 have been selected and you should be able to see thiso nthe spreadsheet. Now, click the insert tab of the ribbon and hone in on the middle section of graphs. Click column and choose whichever "sub graph" you want to produce the chart. Below is a composite of this.
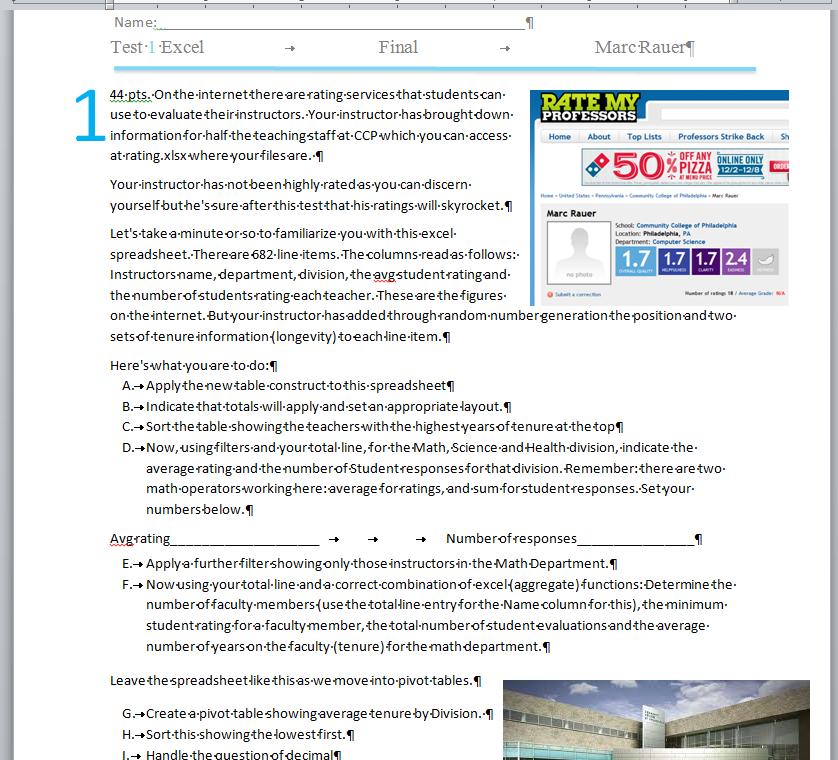
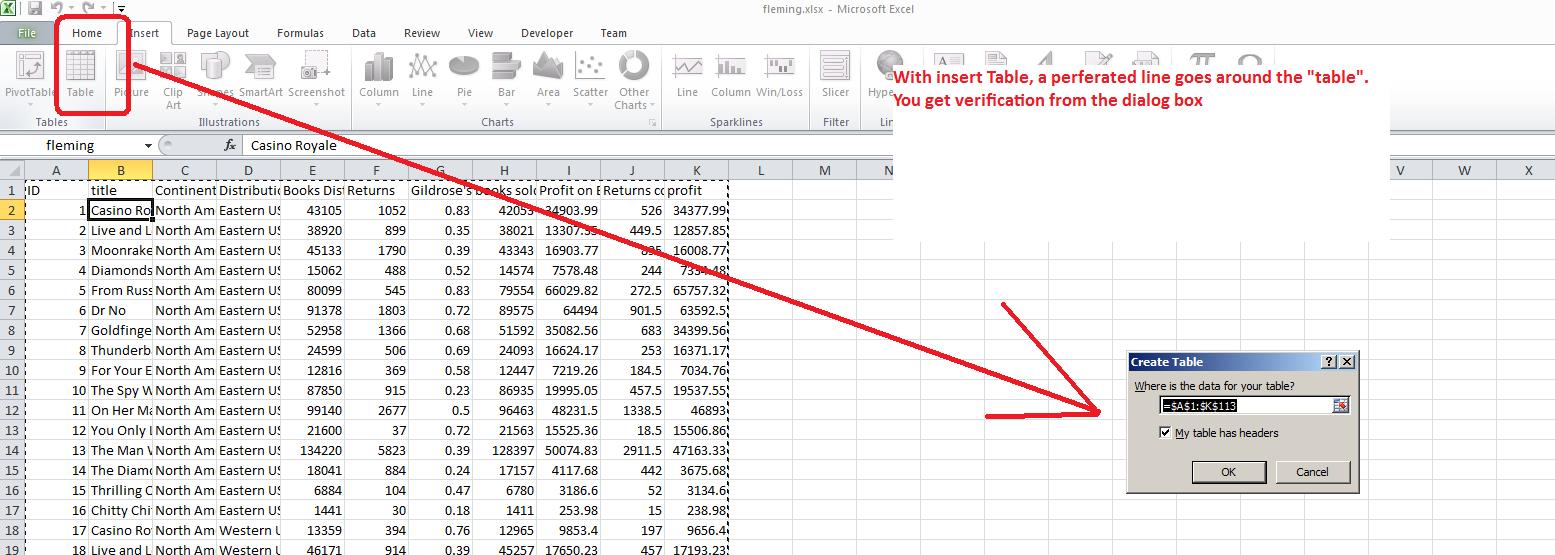
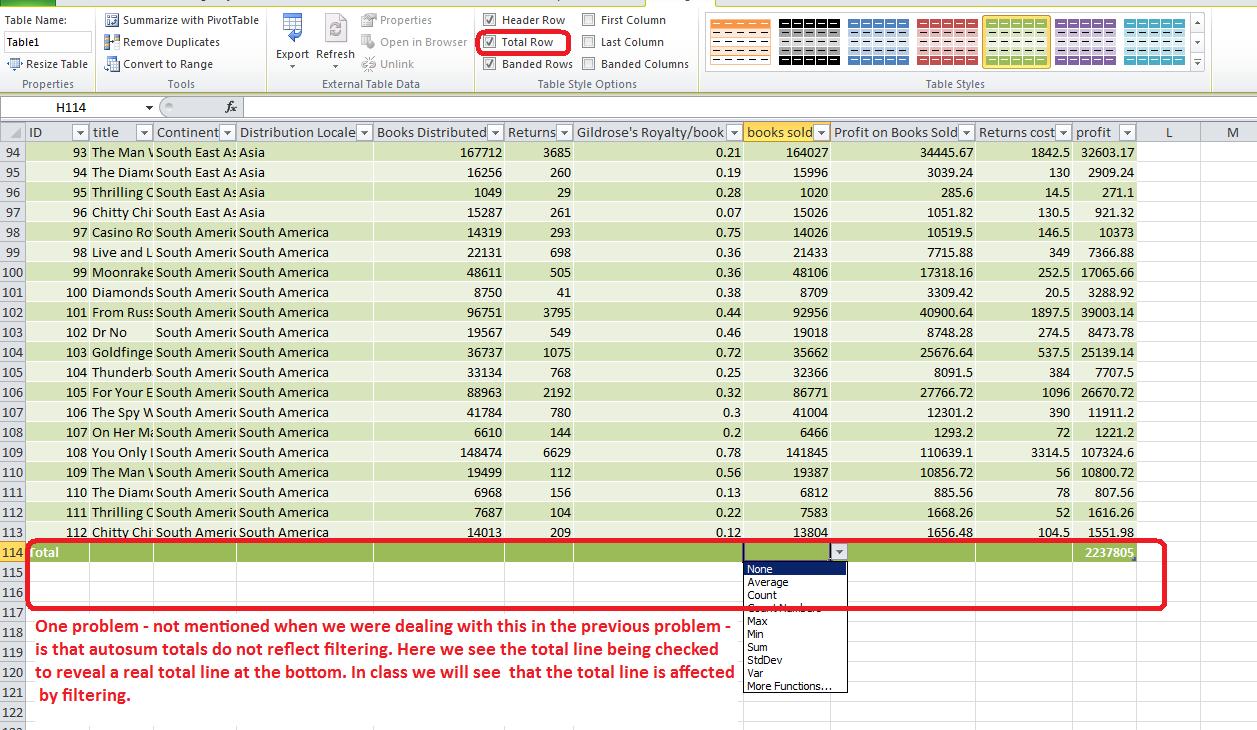
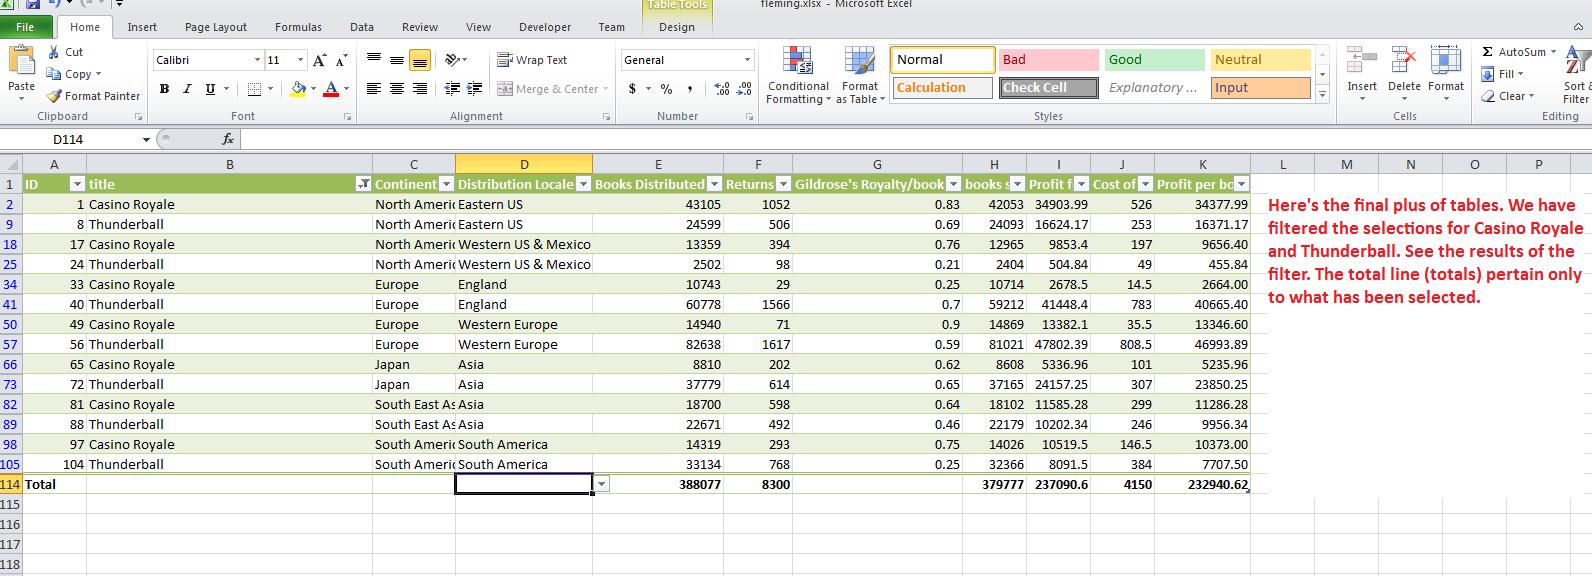
There are many variations that we could use for this problem but we will move onto the books of Ian Fleming. For this term we will be going straight into the new table construct and pivot tables. During other terms I have used a problem to show something called subtotals and another problem to highlight pivot tables only. THis term, excel is being abbreviated so this next problem will cpmbine both.
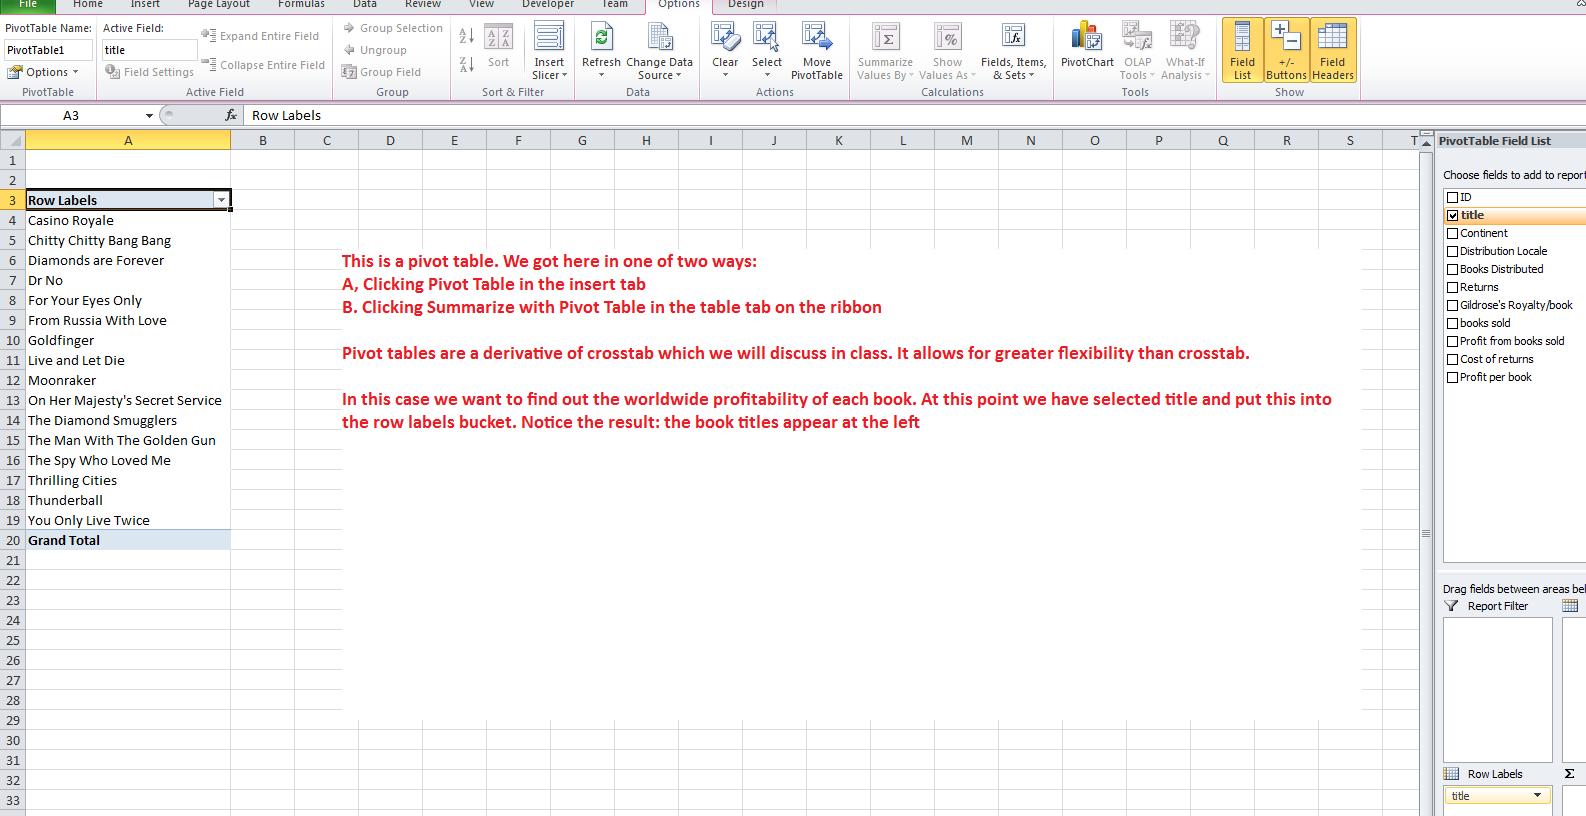
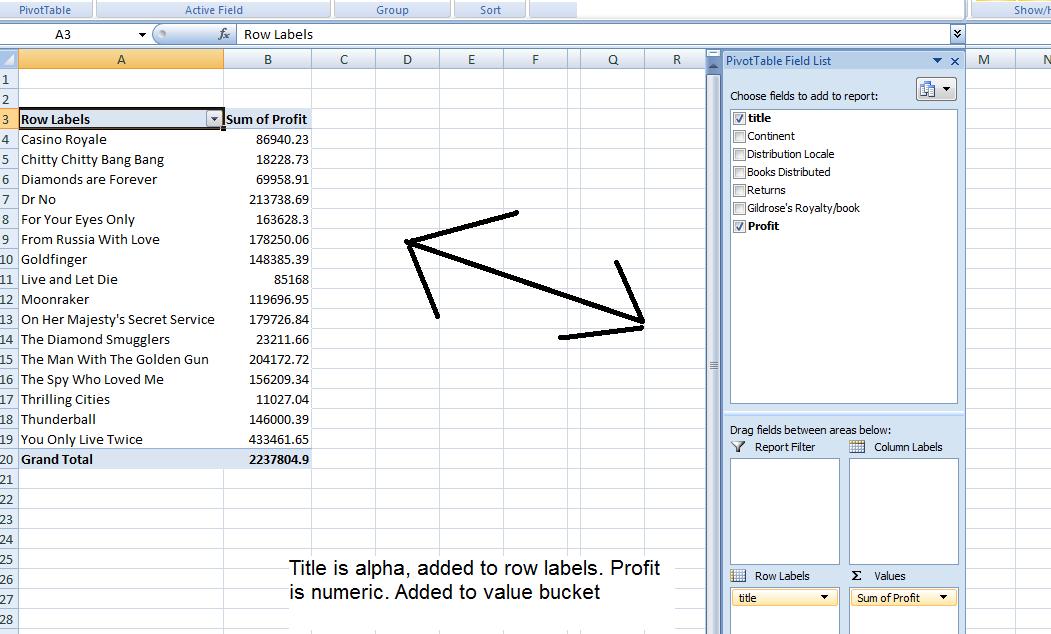
In the pivot table spreadsheet what are the possibilities to the problem. The family wants to know the profitability per book title world wide. This is a 1D problem, but we will be using a pivot table to resolve this. What do we expect as the titles of the row in the table that will be built. It should be the book titles. What should we expect in the cells of the table. Each book title encountered adds to the total for that book title that had already been accumulated.
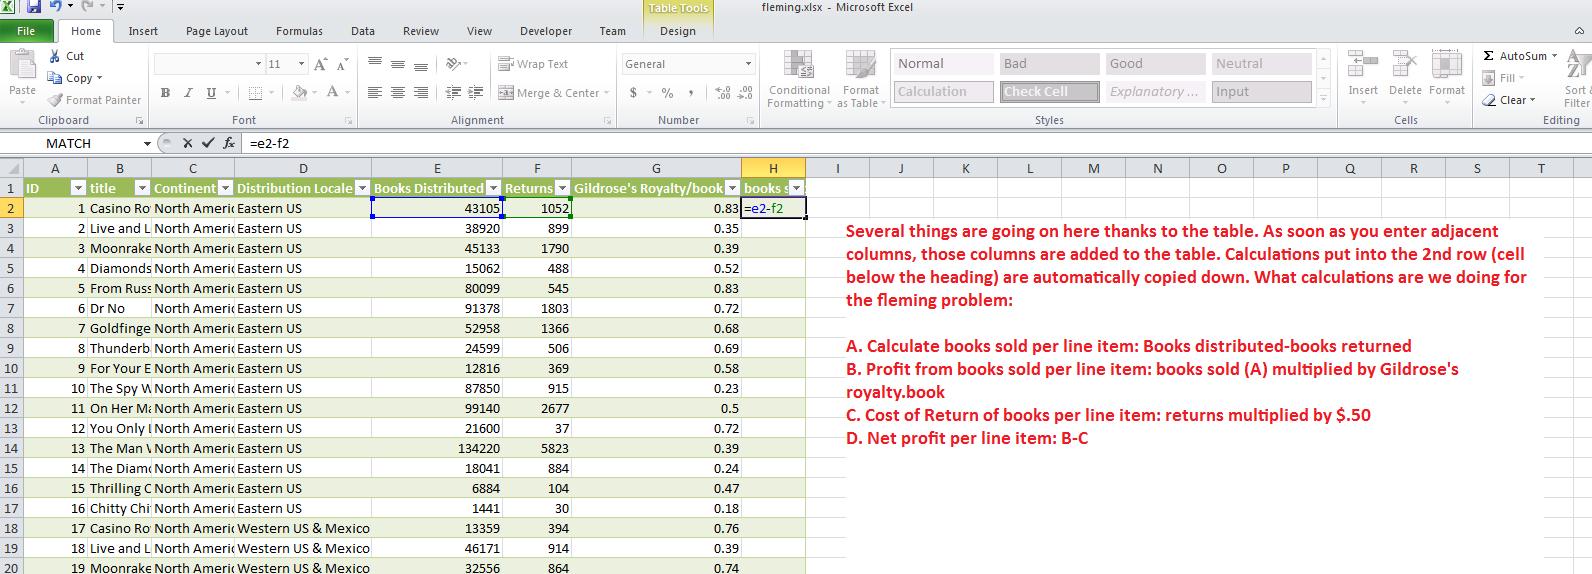
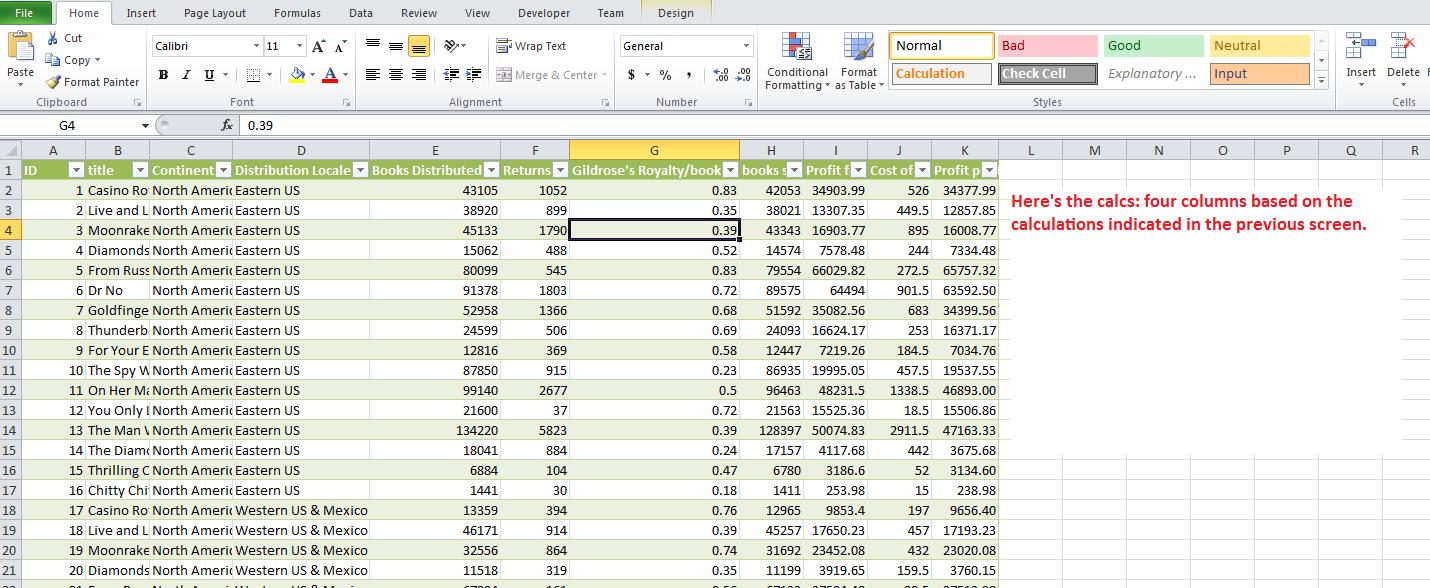
We start the process by clicking thr Pivot Table control in the insert tab of the ribbon. Thhis should give you the limits of the table. Note. Pivot tables need column headers to work. If a column does not have a header it will either not be included or the pivot table will fail. We have designated our new column (for line item profit) as profit. Although there is no requirement, put the pivot table on a new spreadsheet (this is the default). When the pivot table appears, click title as indicated below. Notice at this point, we have listed the book titles in sequential order and the designation title is in row labels. That's exactly where we are at.

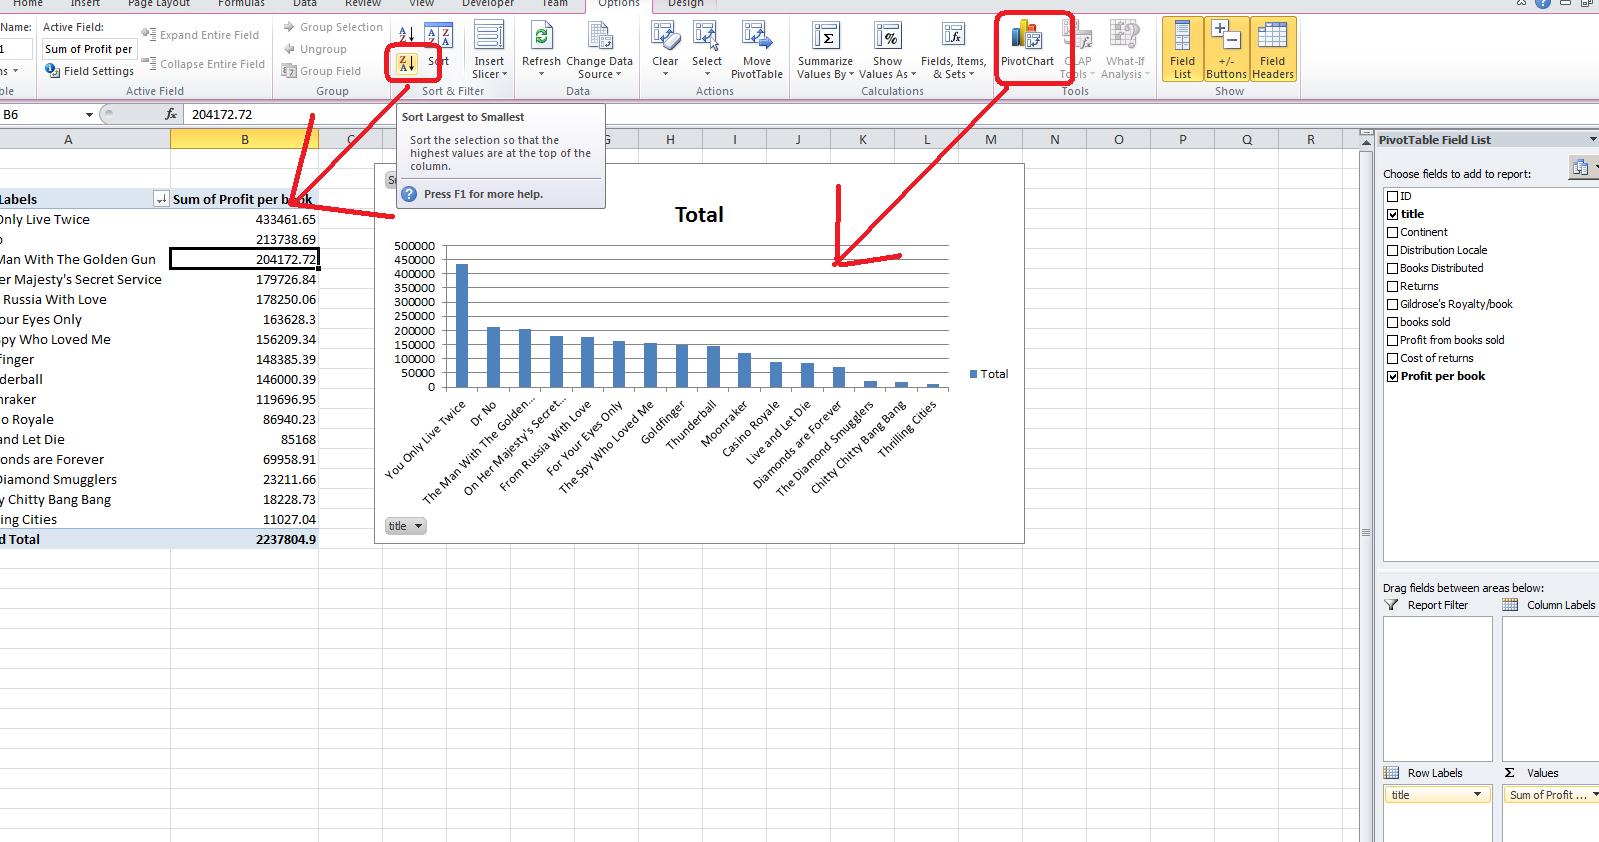
Now, we are looking for aggregate profit per book. Click profit and you will see the pivot table below. By the way, this is not magic. Book title is obviously a text column so when clicking such a column, the system added the designation to the row label bucket. Profit is a mathematical column. Math columns get added to the values (in previous versions designated as data) bucket as you see.
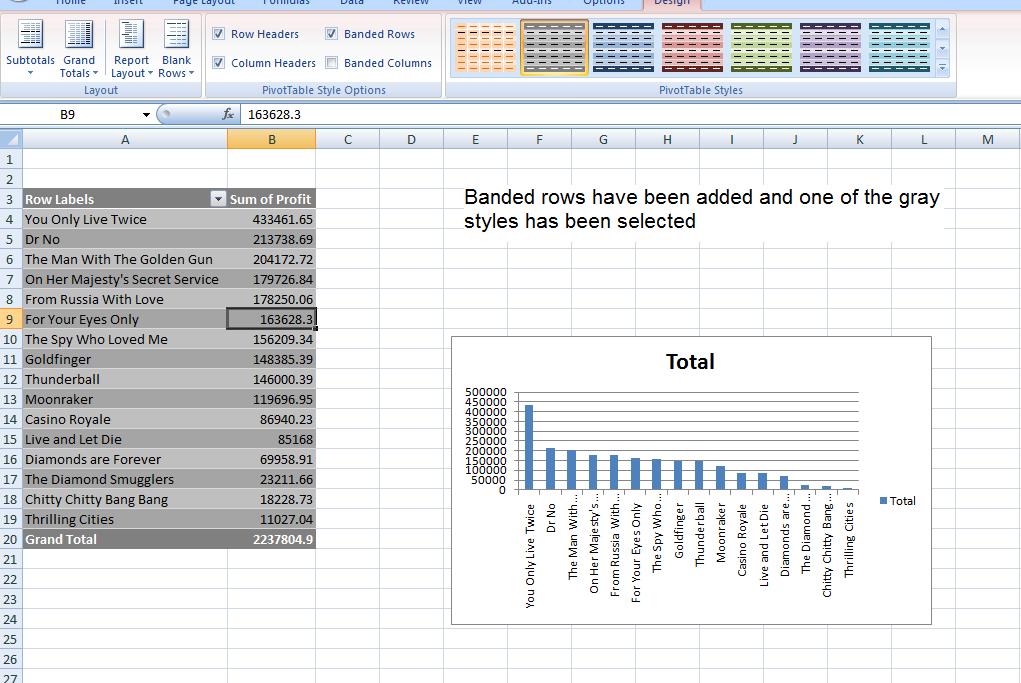
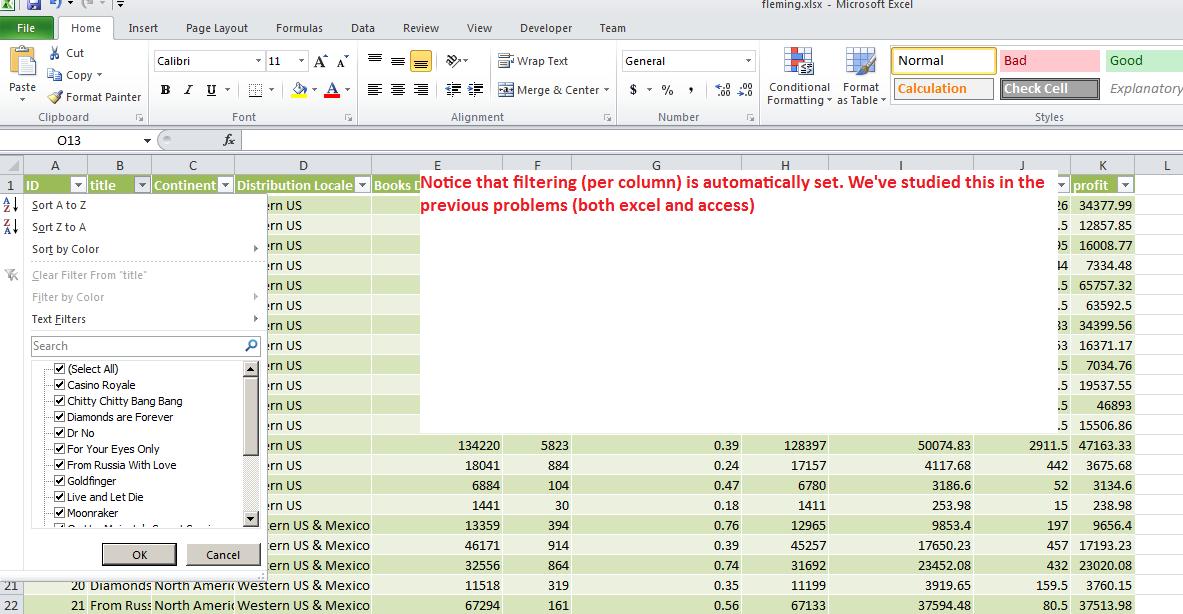
These books are already sorted by name. Probably, the family would like to see the titles sorted in descending order for profit. Your pivot table provides tabs that support its operations. One of which is sort. Look at that section, move your cursor anywhere on the column representing profity and click z to a. Below we see the result.

You know that we can chart in Excel. Charts also exist as far as pivot tables are concerned. Again a bar chart is the best for this problem. Again, look at the pivot table tab. Chart is an option. Click that and select column chart type. A pivot chart is produced with more capability than previously seen. This added capability is geared to turning on or off the charting of different titles.

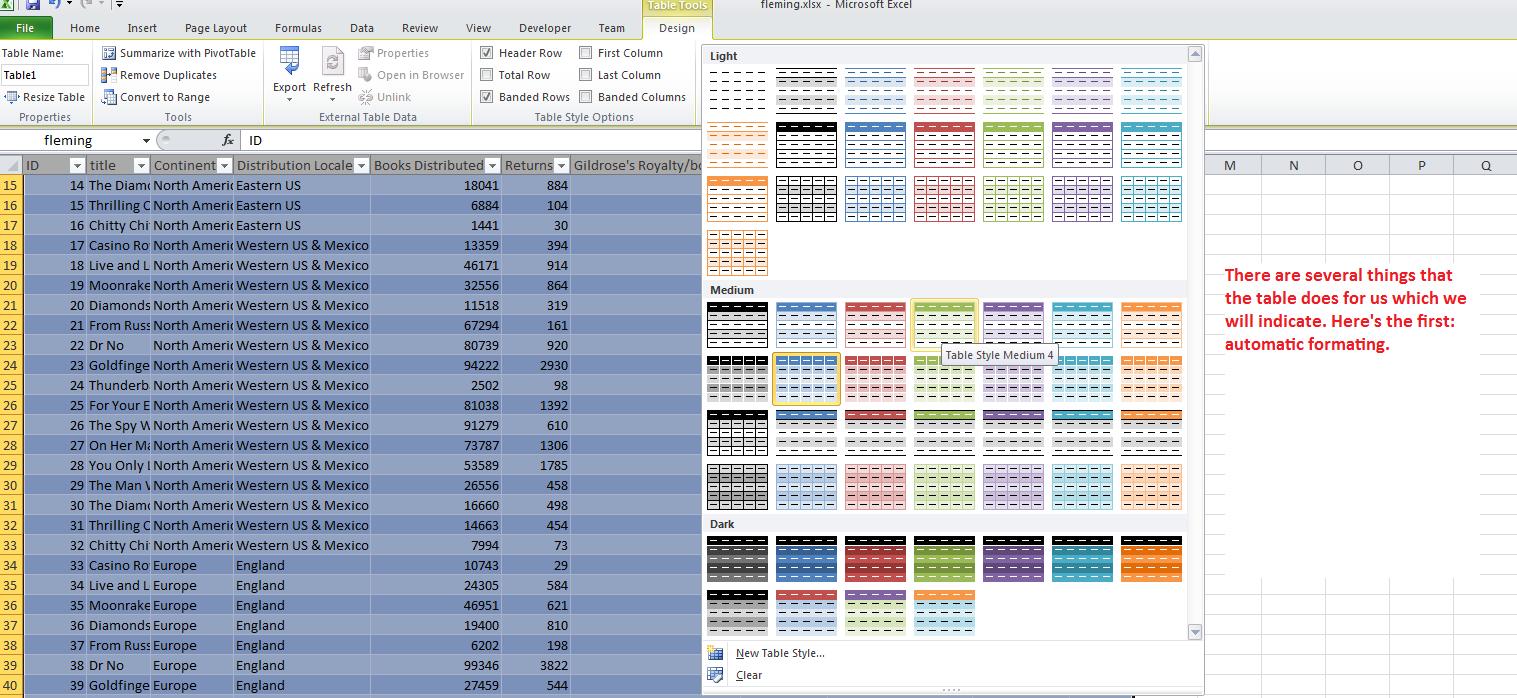
You have formatting options to this pivot table also. Click back onto the pivot table and click the design tab. I have added to this by clicking banding row and selected a gray (some say to go with my personality) format. Below we see the result.
As promised, we are about to deal with detauil info, sum that up into subtotal info, then deal with this subtotaled info for an answer. You can look at this in one D, or in Two D, For Two D (and above) we have 2 possibilities: Pivot tables and the new table constrcut breaking down into pivot tables.
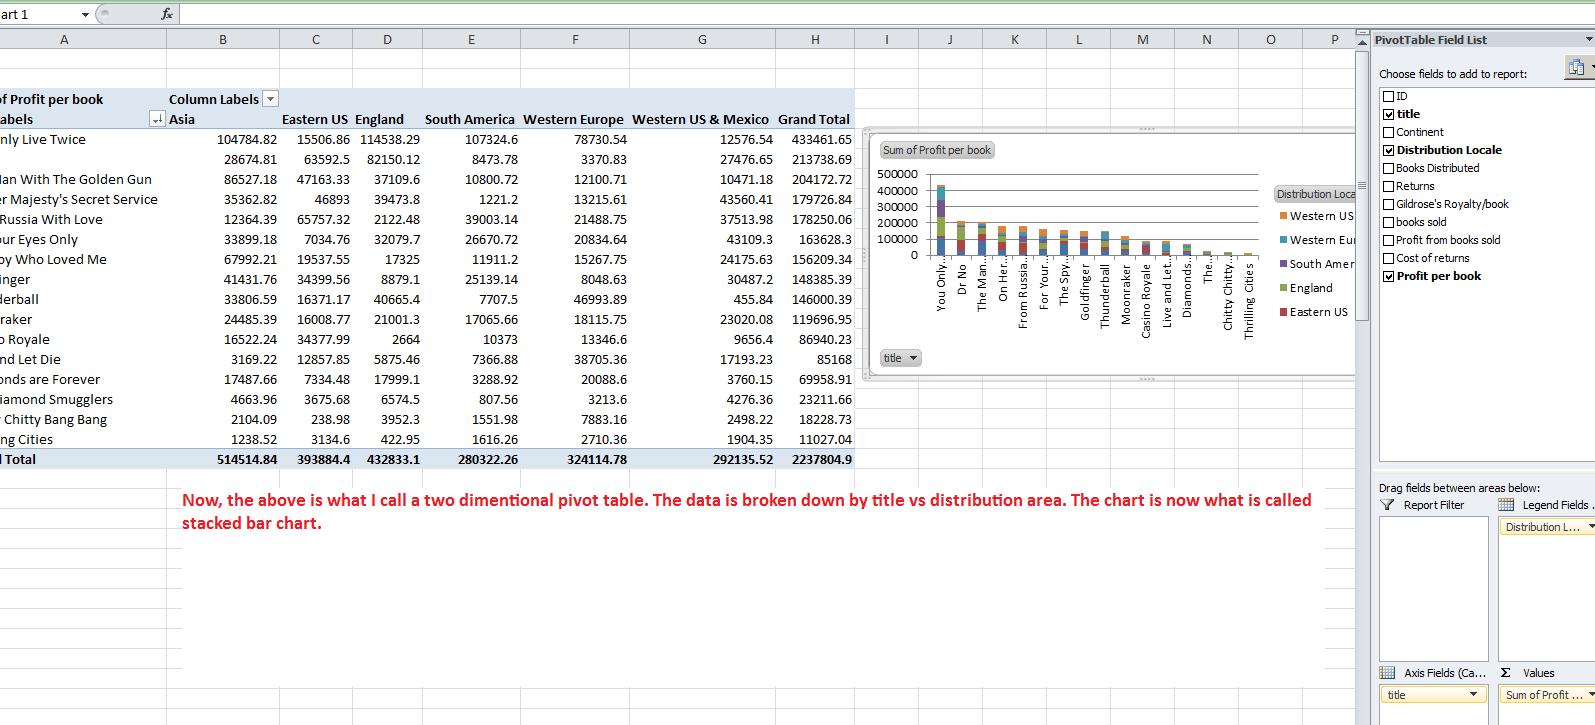
Before returning to subtotals, let's show you a taste of 2D. Move your cursor to continent and drag that into column labels. Once done with that, click in the chart and request a stacked bar chart and you can get the following.

Pivot tables allow great flexibility. We will see the following possibility when looking at the new table construct, but you can select which values of the column (or row) to view. Below, we have dealt with North and South America in the columns.

Another thing you can do is calculated fields. This is tough to control but lets assume you wanted to know the average profit of a particilar book world wide. This is total profit divided by number of books sold. We can calculate this but you first must understand why this is a difficult calculation on our spreadsheet using subtotals. If I can explain the difficulty of this by subtotal, we will look at the creation of a calculated field in excel.
Sheet3 deals with the new table construct.
Unit 3 of your book does Excel under the title 'Electronic Spreadsheets.' For your own info, thec term derives from regular spreadsheets which are extended length ruled (as column and row) sheets of paper that bookkeepers and accountants have been using since the late 1800's.
We will be doing a different problem - one that emphasizes relative addressing. But, in following me, you should be reading and following the book although you will be using my test.
Excel is very mathematically oriented. It uses the mathematics you were taught between the 7th and 11th grade. If there was a question in your mind whether you would ever need that stuff, well, here it is.
Anyway, your instructor should have (or will) discuss the following points with you about excel as we start
For this week's class, let's do the handout - the Big w auto dealership which you can access below. This is a very rudimentary problem which is based on 1985 usage of excel. In dealing with this problem, we are starting our discussion of the nuts and bolts of excel. Starting from addressing we can deal with:
The hardest part of this is understanding relational addressing. Keep in mind that when you put =a2+1 into a cell, excel does not set this as the specific cell a2. if uses an offset (or difference) to tell itself how many rows and columns from the entered cell a2 is. If you are in a4 while putting in =a2+1, excel sets this as a offset of =2 rows, 0 columns. If you are in a1 and set =a2+1, the offset is 1 row, 0 column. If in c2, the offset to =a2+1 is 0 row, -2 columns and in the case of g5, the offset is -3 rows, -6 columns. It is this offset that is used for determining relationships. However, in the case of absolute addressing, =$a$2+1 for instance, a2 is always used.
If you understand relational vs absolute addressing, excel becomes very easy. A 2000 line item table (rows) is as simple as dealing with a 5 line item table with the only difference being the physical need to move through the line items. To this effect, Microsoft has developed the new construct, table, to deal with this. Now, in class, before dealing with the problem for the day, your instructor will show you some examples.
We are going to look at a problem that your instructor has previously done in classes. By time we're done, we will have done many of the techniques discussed in every Excel instructional book. But before we start, you must understand that the use of Excel has evolved over the years. The problems we are doing, and the techniques your book describes at the beginning are circa 1985 in use. Today, Excel is used as a supplement to database info (and similar type situations). There is an expectation that raw data is already available in some form (generally from a database although your instructor deals professionally with a set of problems where data is generally kept on excel spreadsheets) and that this information will need at minimum something called subtotaling. Once this is done, Excel's excellent chart (graph) tools finish up the project.
However, for our first problem, we are looking at entering our own data - we have no where to retrieve it from - and this data has already been subtotalled. Nevertheless, this problem should give us an idea about entering data and formulas, looking at the normal bias of excel, use of ranges and fills, use of various functions and the use of graphs.
So, if your instructor has not given you a handout - or you are going over what was done in class - let's bring up this problem and first discuss it in terms of what you know business to be and to need as far as information is concerned and then we'll start to apply some excel on it. Click here for the Big W auto dealership. Please note: I have changed the underlying document but the pictures (screen shots) use the previous instance of the BigV dealership.
Before discussing this problem, keep in mind that 6 salesmen is not a reasonable assumption today, In real life threr would have to be more salespeople and this is not even considering that most auto dealerships are chains. In doing this problem, we will handle it as if there were many more rows. This would be in preparation of further problems this term that will contain much more information.
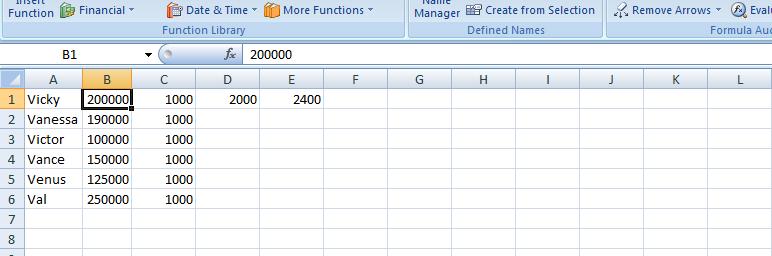
In addition, all spreadsheets for commercial use have headers. We will ignore column headers as we start this problem and they will be put in later. Use A1 through A6 to enter the salesman's name. Use B1 through B6 to enter the amount sold for last month. Notice that excel is giving you informatiin as you enter the data. Non numeric data is left justified, Numeric data is right justified. Notice that Excel has not made any assumption on decimal points and as you put in an integer, that's what's there. Since this is money, should it be left as an integer? Do you have any other options when imputting? Yes, you could enter commas as separators but we will not be supporting that in this problem.
Even before putting anything else in, let's handle column width. Widths start out as standard. At minimun, you can manipulate column width by placing your cursor between two columns at the top (where the colunn indicators are) and use the cursor you aee at that point (I call it a grabber) to change column width. Below, you can see this in operation as both column widths have been decreased.
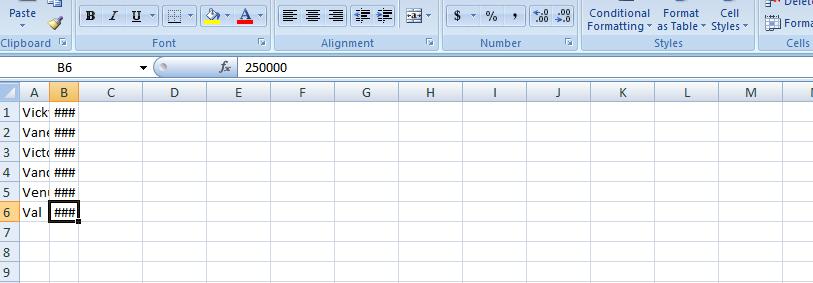
Besides the movement of the columns, look what happened to the data. Text is truncated. Numerics become first scientific notation (one of the allowable entries of numeric data on this system) and then pound signs. Excel is geared for math and it wants to make sure no decision is made on wrong assumptions. If it is trancated as done in string data, one might make a wrong decision seeing the wrong numeric entry. You can bring this back by invoking autofit for column width. A poll is taken on the width of each entry in a column and the widest entry determines the width of that column. If you can fit the widest, all the others will also fit, of course. There are ways to do this by the ribbon which your instructor will show you and by mouse. In terms of mouse, take the column in question and at the right gridline of the column description, double click.
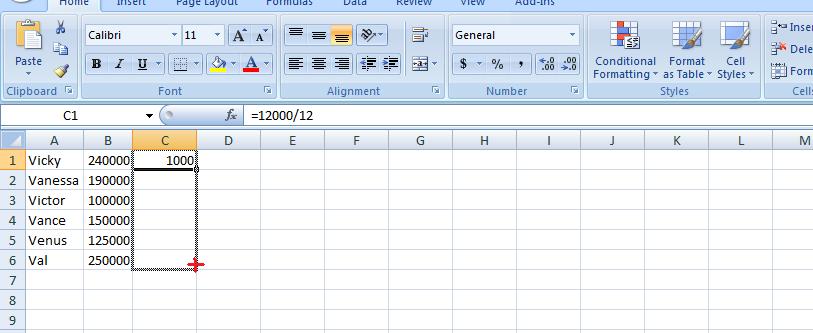
In this problem, each salesperson gets $12000 a year split over the year. That is $1000 a month. Now, we could put in a 1000 for each entry next to a salesperson (column C), but we are going to use some math and relational operators to do the job. Math uses operators to determine what to do with numbers. Common operators (for real math and Excel) is + (addition) - (subtraction) * (for multiplication) and / (for division). To tell excel that you are dealing with a math operator, you need to start the entry with an equal sign (=). If you don't, you violate what excel feels is numbers and your entry defaults to text. The mathematics of this is 12000/12. Put this in at c1. Notice this is left justified and no calculation has taken place. Now try =12000/12. The equal sign indicates to exc el that we have a formula. 1000 shows up indicating that a calculation has occurred and it is right justified. Congradulations, you have done your first calculation albeit an easy one. Now, this is important. There are many things that make excel powerful and one is the ability to replacate relationships. The easiest relationship is a calculation. Move back into c1. There are 3 cursors in excel. The big plus sign is used to select cells and this is a way of creating ranges which we will talk about shortly. At the bottom right of any border in excel one would see a crosshair and put your cursor there now and you will see what I'm talking about. Finally, at the bottom left is both a crosshair and normal mouse cursor symbol combined. This is for moving and would be like a cut and paste in Word.
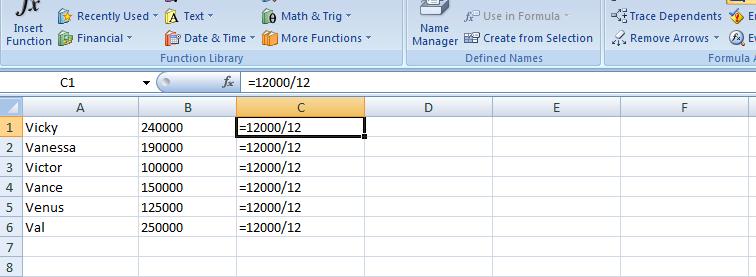
Now, in C1, move your cursor to the right bottom. When you see the crosshair, click your left button and drag the crosshair down the column. Below, you will see an example of this.
Let go of your mouse button and you will have copied this information. Waht was copied. Your relationship. You could see this by moving into each cell in column c and looking at the formula bar. It is easier to look at the screen with just formula. Go into the formula tab of the ribbon and on the right click show formulas. Below, you can see the result.
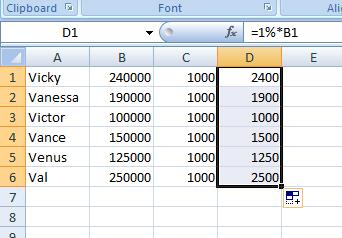
So you can see that you really did copy the cells as far as formulas are concerned. Now, hit show formula again to return to normal mode. We need to calculate the commission defined in our documentation as one percent of the sales amout for each salesperson. First, what is 1%. One could look at this as 1/100. Also as .01. And these are perfectly reasonable. But excel allows you to use 1% which is the easiest. Now, how do we calculate the first salesperson's commission (B1 for the sales, D1 for the result). We could use =1%*240000 or =240000*1% - this is one of the laws in our math which you should have learned in high school. This will work but it is limited. What would happen if the 240000 sales figure was changed (a late sale, a sale that was missed, or a busted sale where the figure goes down) WE would need to change this twice. One in B1 and the other, here, in D1. It is easier to reference the value of a cell than continually use the number. Therefore, our math relationship in D1 should be =1%*b1 or =b1*1%. Put this into your spreadsheet. Now, I am going to use E1 to put in what was originally proposed: use the math expression =1%*240000. Now, let's change B1 to 200000 (a sale of 40000 did not go through), Look at the result in your spreadsheet. Below, we have the example.
See the difference. The moral of this story: use references to cells. Now, let's do the same thing to column D that we did to C. Move your cursor to D1 and its right bottom border. Use the crosshair to fill down. Notice numbers are being put into the cells. They are 1% of what is 2 columns to the left. Use show formulas again and you will see what I have below
Notice that B1 was changed to B2 through B6 as we went along. You didn't do this. You had originally set B1. If B1 would have showed up, you would have been dealing with an absolute address. Excel determined that B1 was 2 columns to the left of D1 and 0 rows offset. As you filled into D2, the corresponding cell would be 2 columns to the left and 0 rows offset. Of course, we are therefore talking about B2 in this case and this was substituted. Look at the others: you will notice that this analysis is working for all these cells.
Now, look at D1. you should be able to see that it references b1. How does Excel look at this. Not as the cell b1. it looks at this as the cell 2 columns to the left. As we copy down this relationship, as it hits a cell and needs to enter a formula, the reference to a cell two columns to the left is enforced. Now copy this down to fill d2 through d6.
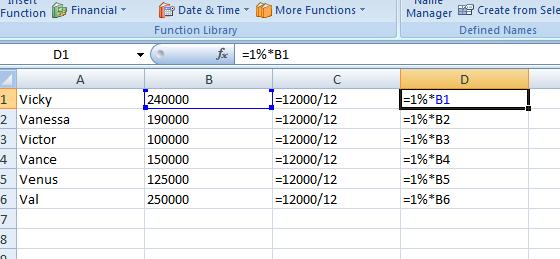 Previously, we have clicked within cells to see the formulas in the formula bar. Is there some way of doing this on a more geenral basis. Yes! In the formulas tab, on the right click show formulas and you will see what we have to the right. This is a good tool to use to see formulas in general as it lays it out on the spreadsheet. Ypu can even operate your spreadsheet this way in terms of entering formulas but you would not see the results. Your instrcutor would recoment that every now and then you click on this, especially if you have a big and complicated spreadsheet, to see if the patterns of the formulas make sense.
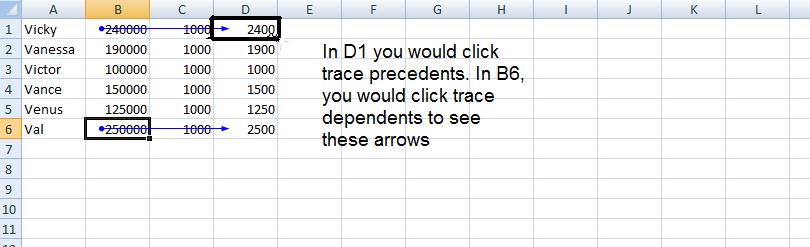
Click show formulas again and you are back to the regular aspect of excel. Excel has some other tools that you can use to get a feel whether you are proceeding as planned. Move your cursor to D1. Staying in the formula ribbon, click trace precedents and an arrow will appear emanating from B1. You can eliminate the arrow by using remove arrow/remove precedents. Precedent is a nice way of saying the di uses b1 in its calculation and b1 is 2 columns over to the left.
Reversely, click in cell b5 and click trace dependents. Notice the same type of arrow going from b5 to d5. On complicated spread sheets this can be a help to trace the flow of the data. Below, we have composited these two controls.
While we are on the formula tab, let's indicate a new control for excel in this version and that is evaluate formula. It's use is better seen with more complicated formulas and you should use this as you study for your test in a few weeks, but it will show you the sequence of calculations that excel uses for get an answer for any cell. Move onto D6 and click this control and you will see these calculations in action.
We have one more column to calculate. The sum of fixed and variable. Let's sum up column C and D. E1 will be =c1+d1. Let's copy down. By E6, what do you think will be our formula. If you guessed =c6+d6, you are correct. And keep in mind, this is the same as =d6+c6.
While we are looking at calculation, this would be a good time to talk about ball parking. Excel does what you want it to do. There is no editorial comment from the program. It has no way of knowing or interpreting what is the ultimate purpose of these calculations. It is up to you to make sure that these calculations make sense. I use equivalents of 1% to determine if in the ballpark. !% is easy to deal with since you drop 2 zeros. In other problems 10% is the marker and yuo drop 1 zero. Let's assume that this problem was working with 1.2% commission. I'd still use 1% as my marker doubling the result to look at 2%. The end reult, when applying 1.2% should be between 1% and 2% and it should be biased closer to the 1%. Look at our calculation at this point 1000 for the monthly fixed should have looked somewhat correct based on the statement "12000 over the year". The number in the D column should correspond to 2 zeros being dropped from the values in B. Finally, the calculations should be easy enough to check the accuracy of column E.
Let's continue. Sheet operations are independent unless you yourself change this. You have been working with sheet1 and probably have not realized that sheet2 also has calculation in it. Click on sheet2. Here's are problem again but with 2 columns. Look at the last column indicated in blue. We have been dealing with something called relational addressing. 3 other addressing schemes exist in Excel. For this class, we will deal with one other, absolute addressing. Using trace precdents, click on G6. You should see something like below which is very different than what we have seen before. This is crosiing rows. In absolute addressing, which is indicated by a $, you really are using the addresses indicated. Therefore $c$1 stays as $c$1 as a fill takes place.
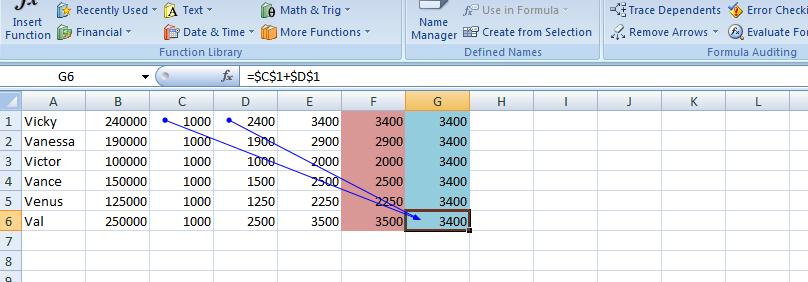
Having dealt with absolute addressing, what about column F. The results look the same as E but the calculations are done very differently. We are using a function designated as =sum(). As with many functions, this can be widely used: as an example =sum(first, second, third, four) would be legitamate where first, second, third and fourth are something called ranges or cell or constants (in math). So, this brings up what is a range?
For this class (and this has changed with the additon of the use of the extended selection by way of the ctrl key) a mouse selection that resembles a rectanggle is a range. Take an example. Select c1. Drag your mouse through c6. C1 to c6 make a rectangle and a range. You can designate as c1:c6 or c6:c1. Similarly, we have the same situation with c1 and d1. They make the range c1:d1 (or d1:c1). By placing a range in the sum function, you can sum up all the elements (cells) indicated by the range. So, you see the f1 contains =sum(c1:d1). Ranges are similar to cell addressing in that they can be manipulated. One fill filled up column F.
Let's go back to our sheet1. Column totals wouldn't be a bad idea for B,C,D and E. Can you figure out the fastest way to do this. If you said range, you are correct. We'll show you two ways to do this as we are in class
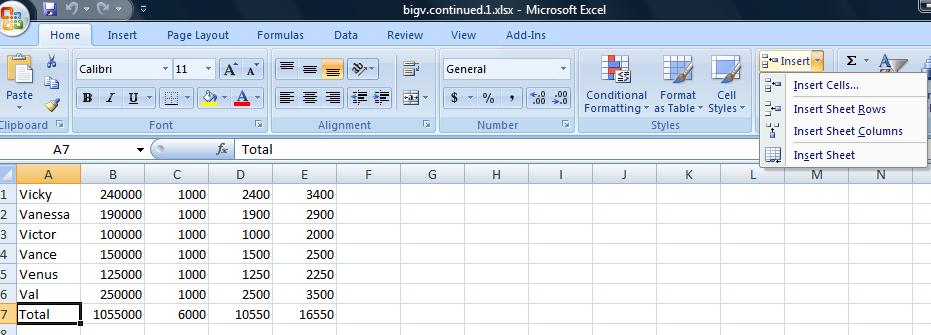
Previously, we discussed relational vs absolute addressing (and we are using relational for this problem although I may show you an example of absolute at the end of this lecture, today. Manipulation of widths of columns and how Excel deals with numbers when the width is too small vs numerics. We looked at ranges and how these are used with the function Sum() and used Sum() (and autosum) in column totals among other things. You also saw how to turn the spreadsheet into a table of formulas. Now for today, we are going to deal with insertion of rows (possible columns) and setting up a set of column headers. Also, how to gruop columns (and rowsfvor the matter) and the creation of a very limited graph).
We are going to look at insertion. This can be done on many levels including insertion of a cell, a range, a row and a column. Unless you are at the row and column level, a second question is asked of you. Are you moving down the other cells by rows or by columns. You are not asked this question when a row or column is inserted. In additon, there are two ways of requesting insert. The one not recommended by me is the formal approach using the insert control on the home tab as indicated below.
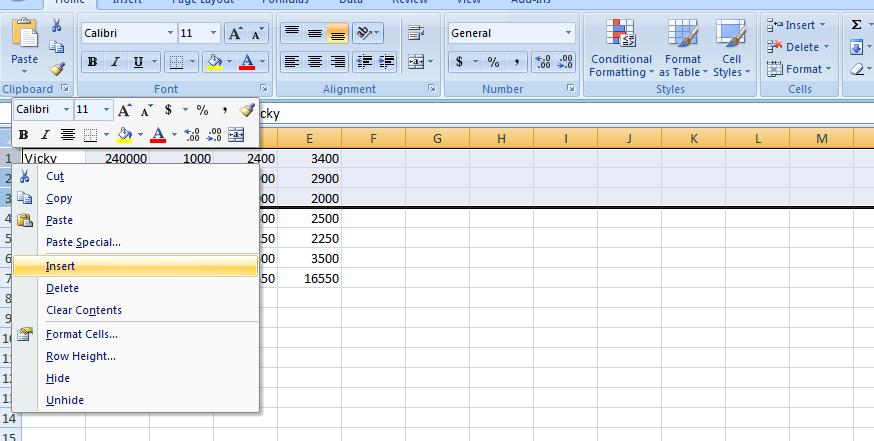
In the case of an insertion of a row (or column) to use the context sensitive popup using the right click of the mouse. To sdo this, click the row that will move down when the new row is inserted. n the case of several rows being inserted at the same time, drag your mouse and select the number of rows where the first row will move down. In our example we need to add 3 rows. One for the title of the table, a blank and then the column header. Below, you see the start of this, Rows 1 to 3 are highlighted. A right click has made the pop up menu appear and we are about to click insert on that menu.
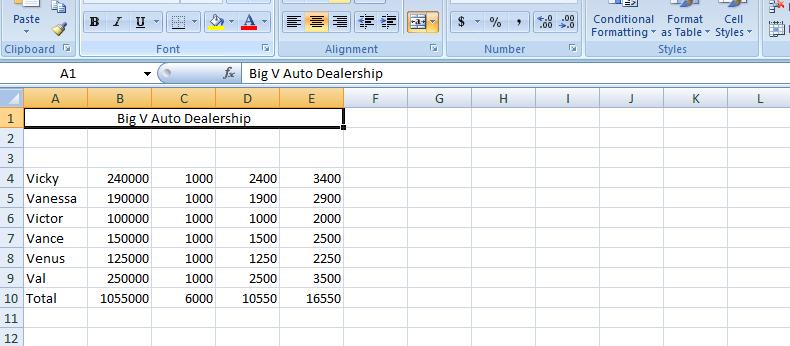
We can handle the title first and it can be as simple as the Big V Auto Dealership. We want this to center over our table. Insert Big V Auto Dealership in A1. It will bbleedc into b1 abd probably c1. Highlight the range a1:e1 and click the merge and center button in the alignment group of the home tab. What we've done here (as mentioned on Wednesday in class) is create a large A1 spanning to F1. And our result should look similar ot what we show below.
Now, we will allow the blank row to stay at row 2 as it is but now let's concentrate on the header row which we will put in row 3. Each cell of row 3 will provide header info for that column. But it's not going to look good as we first put it in. We will have to manipulate the row as you will see. But first, let's enter the info. Column A is Sales Person. Notice how it bleeds into the next cell. That next cell should be Sales Amount. Column C is fixed. Column D is sales Commission. And, finally, column E is total Salary.
One solution would be to widen the columns as demonstrated on Wednesday. While it will work, it will make the spreadsheet look odd with the columns being to big. WHat we would like to do is have the system break the cells so that there may be multi-leveled descriptions. And that's what we are going to do. But first, let's bolden these descriptions and increase the point size. With row 1 selected (and this is done by clicking in the descriptor of row 1 where it says 1), increase the point size to 12 and click the bold button.
Now, you have two choices as to selection. You can use the pop up menu as we have done before and select format cells or the format control on the home tab and select format vcells. Below we show both possibilities.
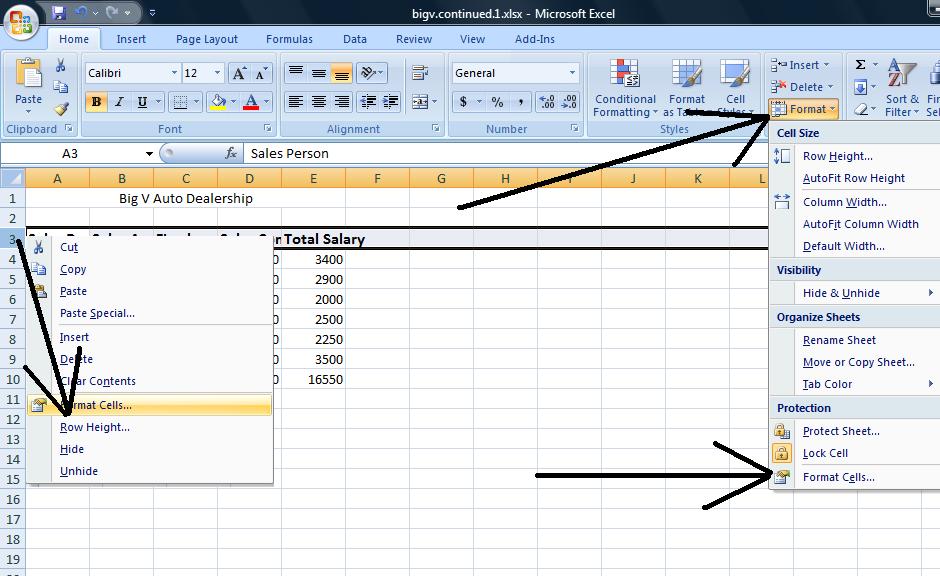
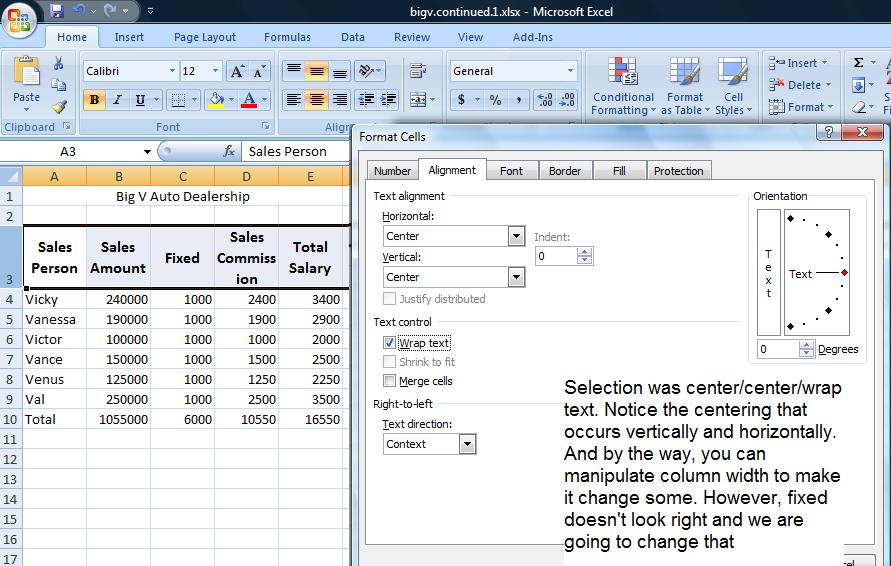
Click on format cells and you will se a dialog box pertaining to 6 possibilities for the range selected. One, protection, we will not deal with. Font generally can be dealt with using the font group of the home tab of the ribbon. Even number, which is very important, can be dealt with through the number group of the home tab. But alignment still holds importance and we want to click this. Notice there is a check box, merge cells, and in essence this was used to create the title in Row 1 although it is easier to control through the icon we used.
There are two combo boxes which control the type of formatting on a vertical and horizontal level. To start out, use center and center and click the wrap text check box. This is the most important of the control although you would not know it by the placement. Below we show a compoasite of these selections and the result.
Fixed really should be at the bottom and this would have occurred if the vertical controls were set to bottom. Further, you might want to set this text at an angle and the picture below shows this using a 45 degree angle.
If you want, you can set this back. We now want to set up 3 rows below this table indicating for each column, max, min and average. Our table stretches to row 10 so let's use row 12 to start this. To get an averagbe, indicate a range in the =average() function. Likewise for max using =max() and min using =min(). So in B12, set the function =average(range) where range is B4 through B9. Why not use B10?
Similarly, in B13, set up the max and in B14, set up the min. Similar to our totals, these are relationships that can be copied over. But you do not have to do this a row at a time. Excel is smart enough to fill up ranges. Select the range B12 though B14 and then grab the handle and copy over. See how easy this is! Below is a composite of this.
We have our spreadsheet and then some. Suppose we would like to prepare it for a few viewers. But the needs are different for any of them. There is the owner who wants to know what amount was sold and what the salaries were. There is the accountant who need to see all numbers. To resolve this, Excel provides from grouping which on the operating system is called un Or decompress and compress. Here we have group and ungrouping of rows and columns. This is done on a specific entire row or column basis. Group and ungroup is found on the data tab of the ribbon.
Let's start this looking at columns C &D - fixed and variable. The big boss is probably not interested in this so highlight the entire column c and the entire column D by clicking insider the descriptor headings of c and D. Now, click group on the data menu. A new section opens up with new controls. Use of the controls (both to the left and above the columns) allows you to compress C & D from view or make them visibile. Similarly, let's do the same for rows 12, 13 & 14. hen compressed, by the way. a printout will not showe these columns and/or rows so this works even when printing. Below is an example of this.
A graph or chart might look good here. Let's reference the sames person's name and show their salary. What type of chart would work to do this. Probably a bar/column chart. Microsoft calls that we woud normally call a Bar chart, a column chart. For this class bar abd column is interchangeable and you can do either when asked to do a bar chart.
Over the years, excel has made it easier and quicker to invoke a chart. Here's how easy it is. Drag you mouse over the names of the sales people including the column header, Sales person. Do not include total info. You have selected a range, A3 through A9. Now, depressing your control key, extend the range by dragging your mouse over the salaries. Again include the column header by do not include the total. This is the extended range I alluded to previously and it is only with this type of charting that we will support it. Now, at the moment, A3 through and E3 through E9 have been selected and you should be able to see thiso nthe spreadsheet. Now, click the insert tab of the ribbon and hone in on the middle section of graphs. Click column and choose whichever "sub graph" you want to produce the chart. Below is a composite of this.
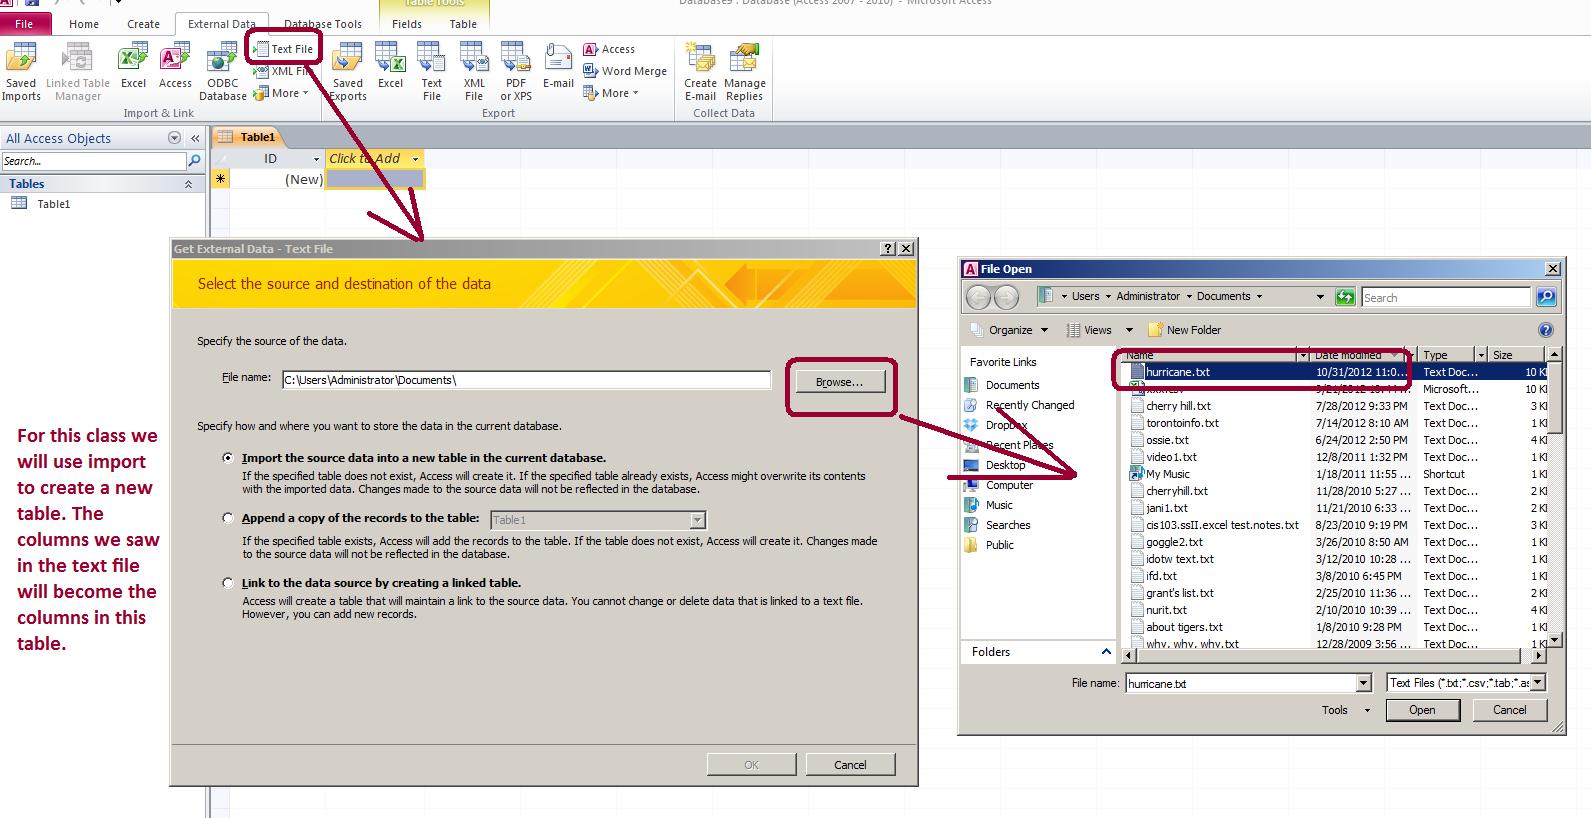
The Morning class went further than the afternoon class. For the afternoon, click here for the text file representing the hurricanes hitting the US mainland. We want to convert this to a table in a database. Let's crearte a new database called hurricane and click on the external Data tab and in the import and link group, click on
For the afternoon class, you have created the database. For the morning class, we did this last week. You can pick up the database by clicking here.
There is one table in this database. By coincidence both the table and database are named hurricane but this is not a requirement. Let's answer some questions. What was the strongest storm given the highest wind speed? Lowest barometric pressure. Sorting should give us our answer.
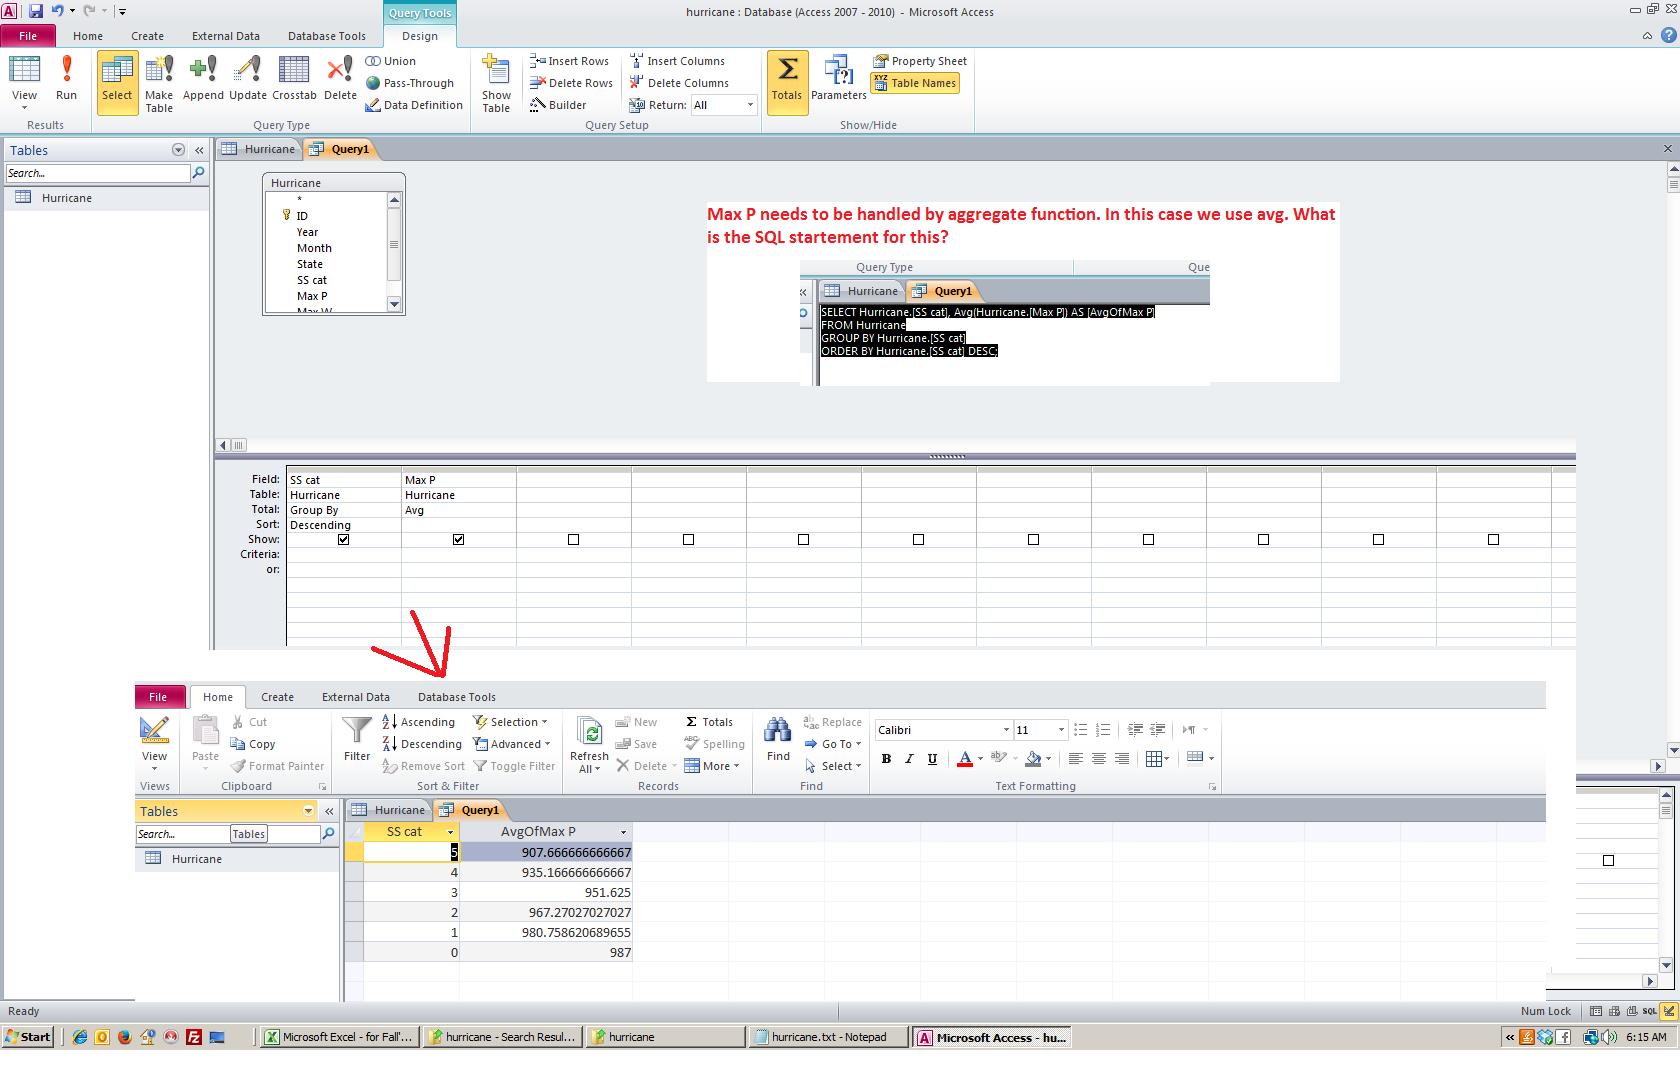
The next several questions will need aggregate functions. What is the average wind speed for all the storms to hit the US? Since 1950? What is the average pressure for cat 1, 2, 3, 4 and 5. And finally, what is the average pressure for each category since 1950.
Per the question pertaining to the average per category for prssure, below we show the query and result.
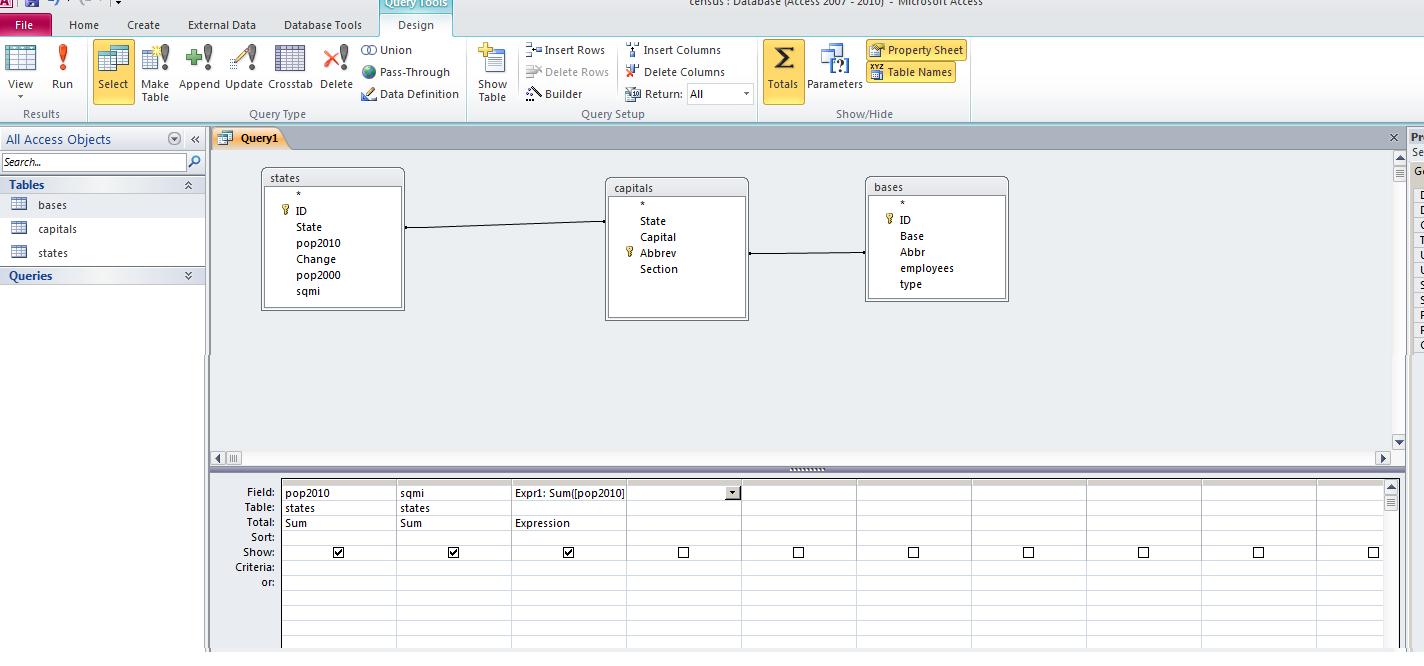
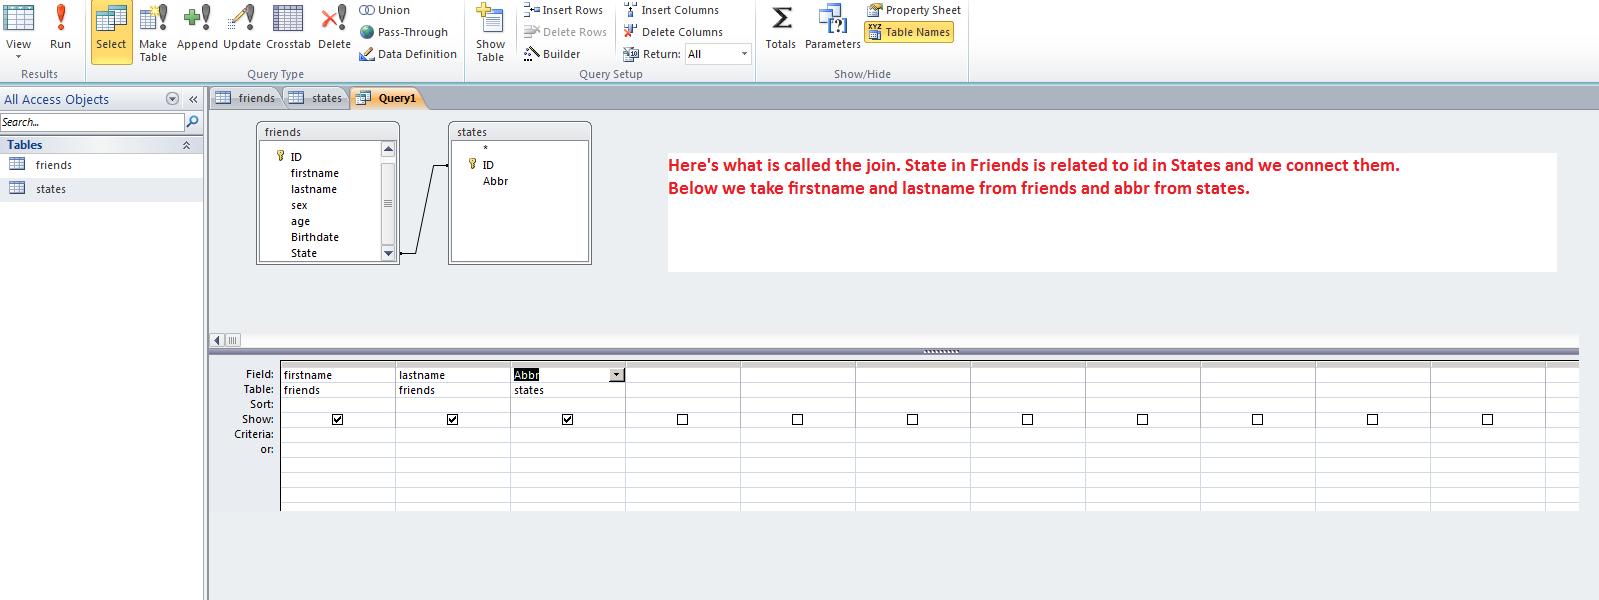
For today we want to look at the basis of a relational database. What we are really looking at is the inter relationship between different tables. To look at this we will use a database consisting of 3 tables. One table consists of states with population indications. Another shows the state with the capital of the state. The third indicates the military bases operating in each state. You can access this database by clicking here.
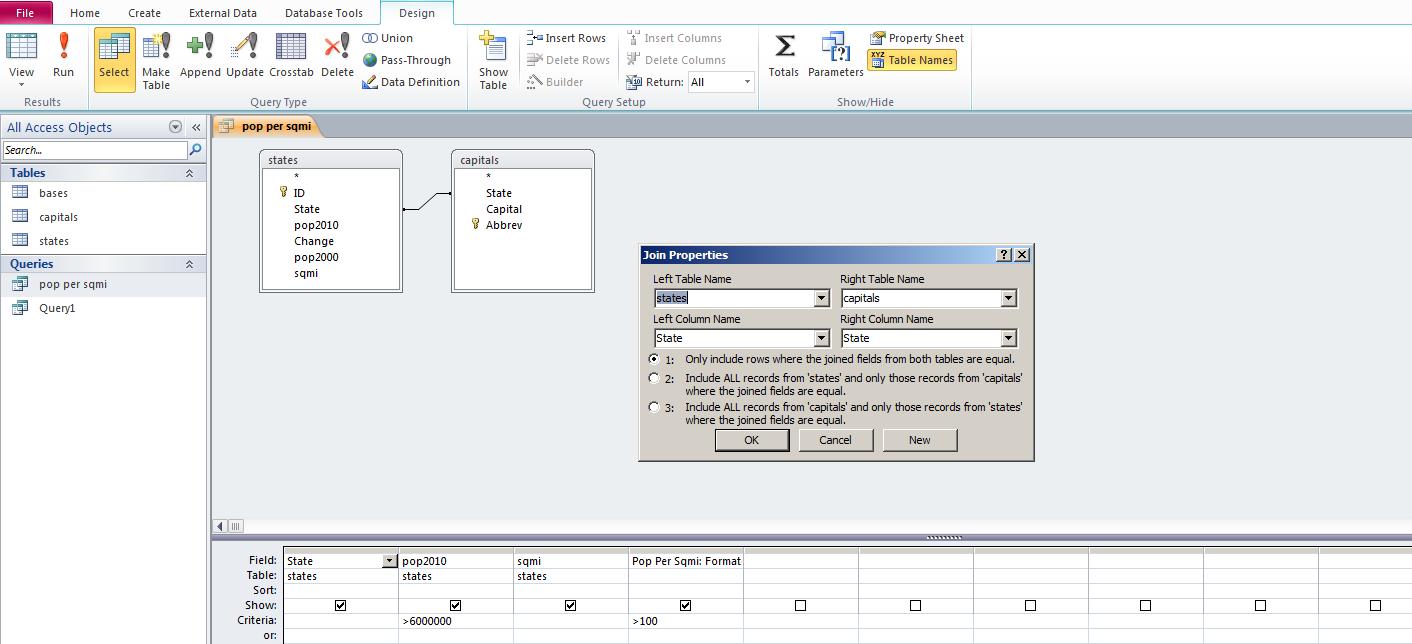
I have put a query into the database called pop per sqmi. One class got to this, the other did not. so let's start with a join. Add to the tables being shown with capitals. if not already, set the link between state of states and state of capitals as shown below.
Here's the power of relational databases. Links designated as joins allow the interchange of information between tables. inner joins, the one we have here, go 1 to 1. If somethng is missing in either table, it is not shown in the result. Left joins in Access (and Access does not do all the possible combinations that higher level SQl databases allow) look at states, and state within states. All the entries of states.state are shown even if a link does not exist. The same on the other side, known as a Right join. All of Capitals.state would be shown whether or not a corresponding link is available in States.state. Below, we see the beginning of this.
The easiest way to add a column in the grid is to highlight where it should show and click insert columns above in the design tab. Below, we've done that.
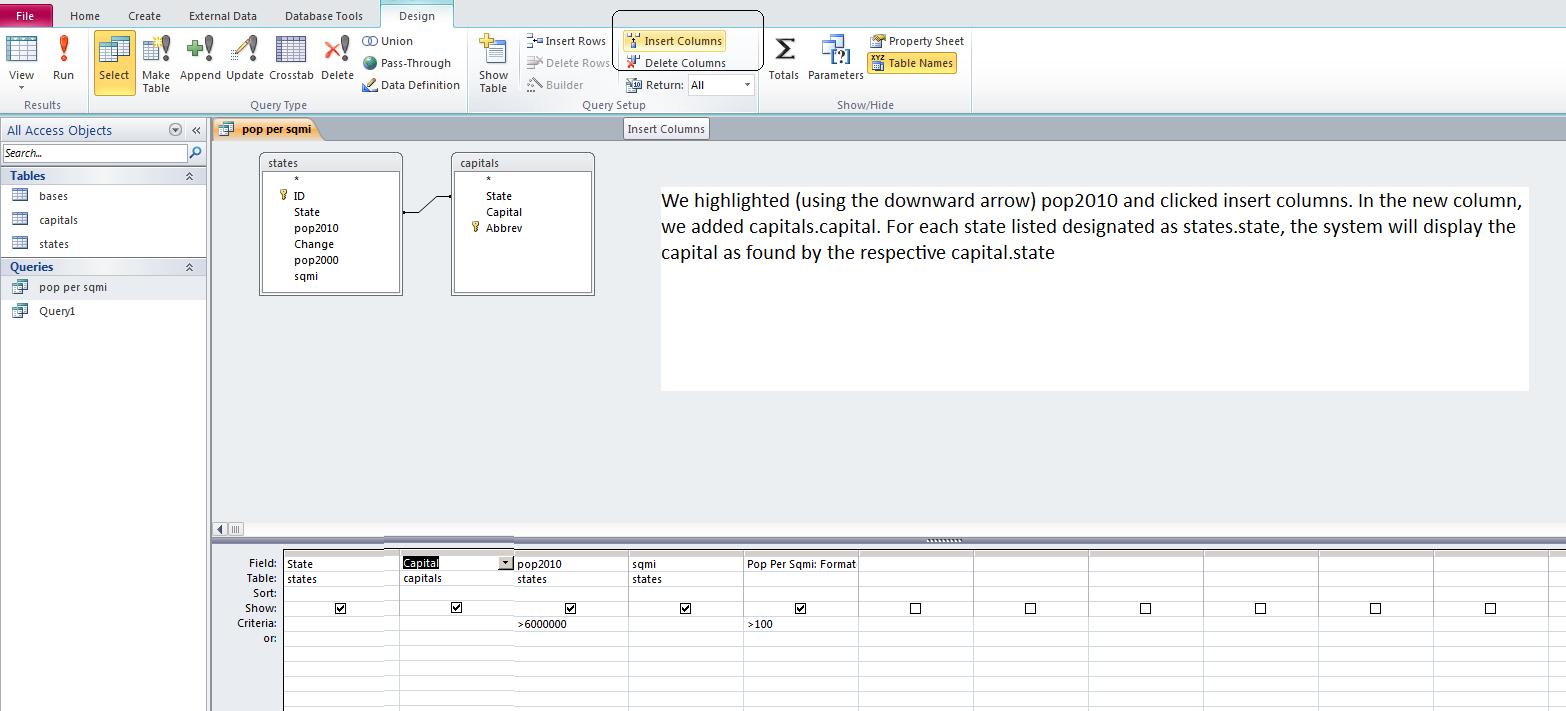
We can do some math here remembering that we are dealing with summary data. What is the population density of the whole country. Sum the pop, sum the sqmi. But we need the sum of the pop divided by the sum of the sqmi. Notice the use of the aggregate functions to calculate this.
Let's finish this out by adding the bases table similar to what we did for capitals. Notice the bases table has abreviations for state designations. Abbreviations also exist in capitals. If it doesn't do it already, set a link from abbrev in capitals to abbr in bases. This should prove to you that there is no need for field (or column) names to be consistent between tables. Now, let's add as fields base and employees from bases and run that. The result should be similar to what's below.

Notice that we have shattered our 1 to 1 relationships. There are many bases per state in most cases and thios is what is shown. Because Access is a lower level SQl database, it is not as flexible as other SQL databases and you will have limitations as to inner, right and left joins. Generally I have found that Access will access a SQL statement consisting of all inner joins, all right joins or all left joins. We mention this because there are bases in all the states and we are only displaying those bases in states with pop2010 > 6 mil and pop density > 100.
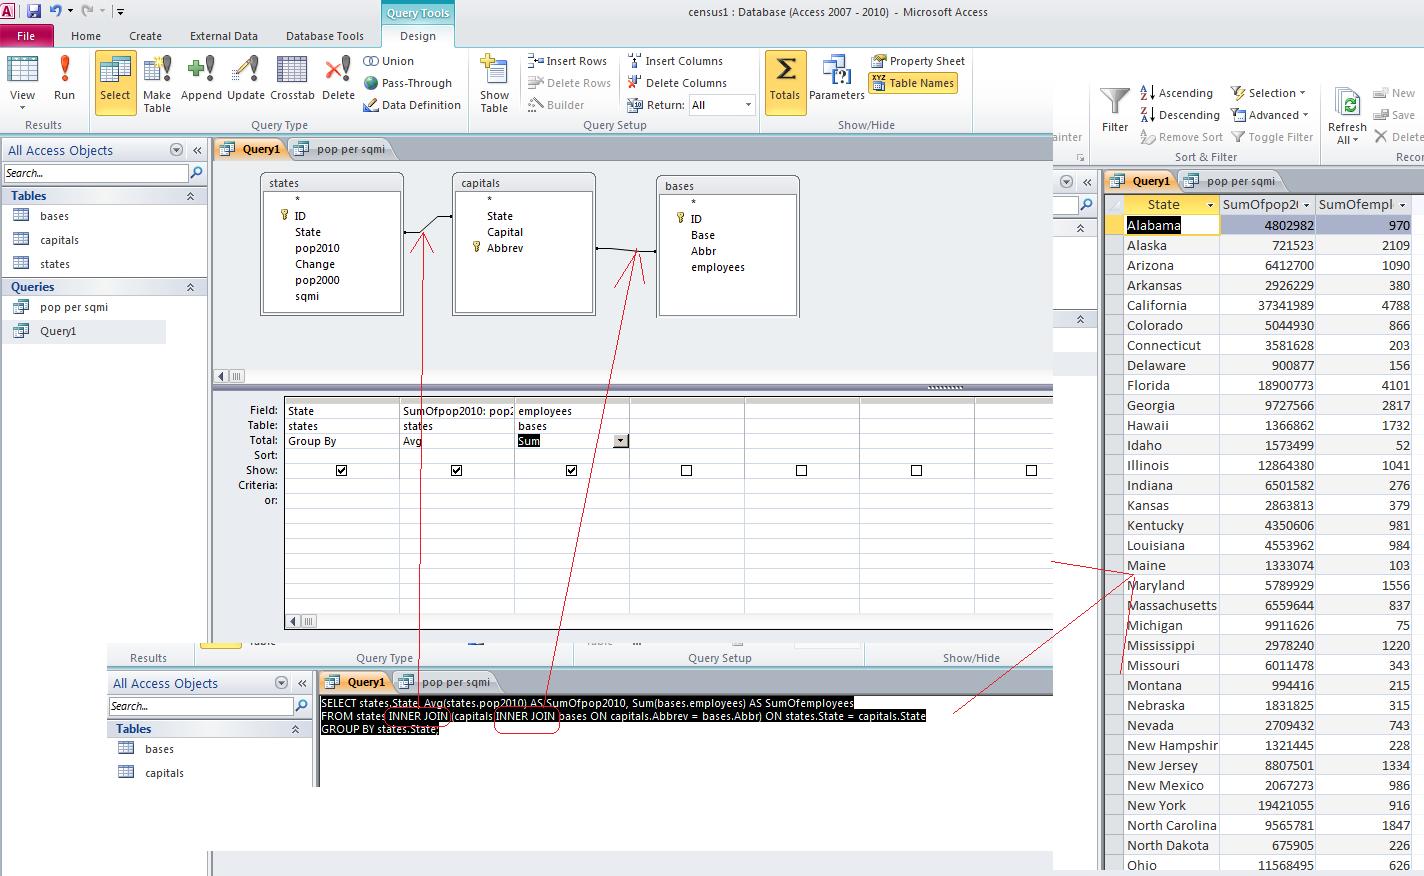
We would like to determine the population of the 50 states. To do this, we invoke aggregate functions. Here's where there are real limitations to how SQL is syntaxed. Let's start slowily. In SQL view, just put in select sum(pop2010) from states. The result is 309183463. The sum is an aggregate function. Let's find out the state average. Substitute avg for sum. The average state has 6183669.25 population. All right. Go into design view. You can see a total row has been added which allows you to enter these aggregate functions. Now, add the bases table. We would in addition like to find out all the employees of the bases per state. Notice, we have no link. States are spelled out in states, abbreviated in bases. Let's add the capitals table to rectify this. If the links don't show up, set them.
Now, let's add state name as the first column. Somethng been added. Do you see the group by. Without group by, SQl stops in its tracks. Aggregate cannot be displayed with specific line item info in Sql unless that line item data is acknoledges to be a group by. QBE handles this for you; Sql view does not. To finish this problem, click for employees. The system with set group by as a default. Click for sum. ANd then let's run. If you did this right, you have the population for the atate and the sum of the employees for the bases that reside in the states. Below, we show this,
We still have to resolve the underlying problem of last class. What is the percentage of a state's population that works in military bases? You can access this database by clicking here.
Below is our calculation to determine the sum of the employees in military bases per state (this is subtotaling using group by), taking the population of each state (detail so part of group by) and then doing a calculation involving a detail and aggregate.
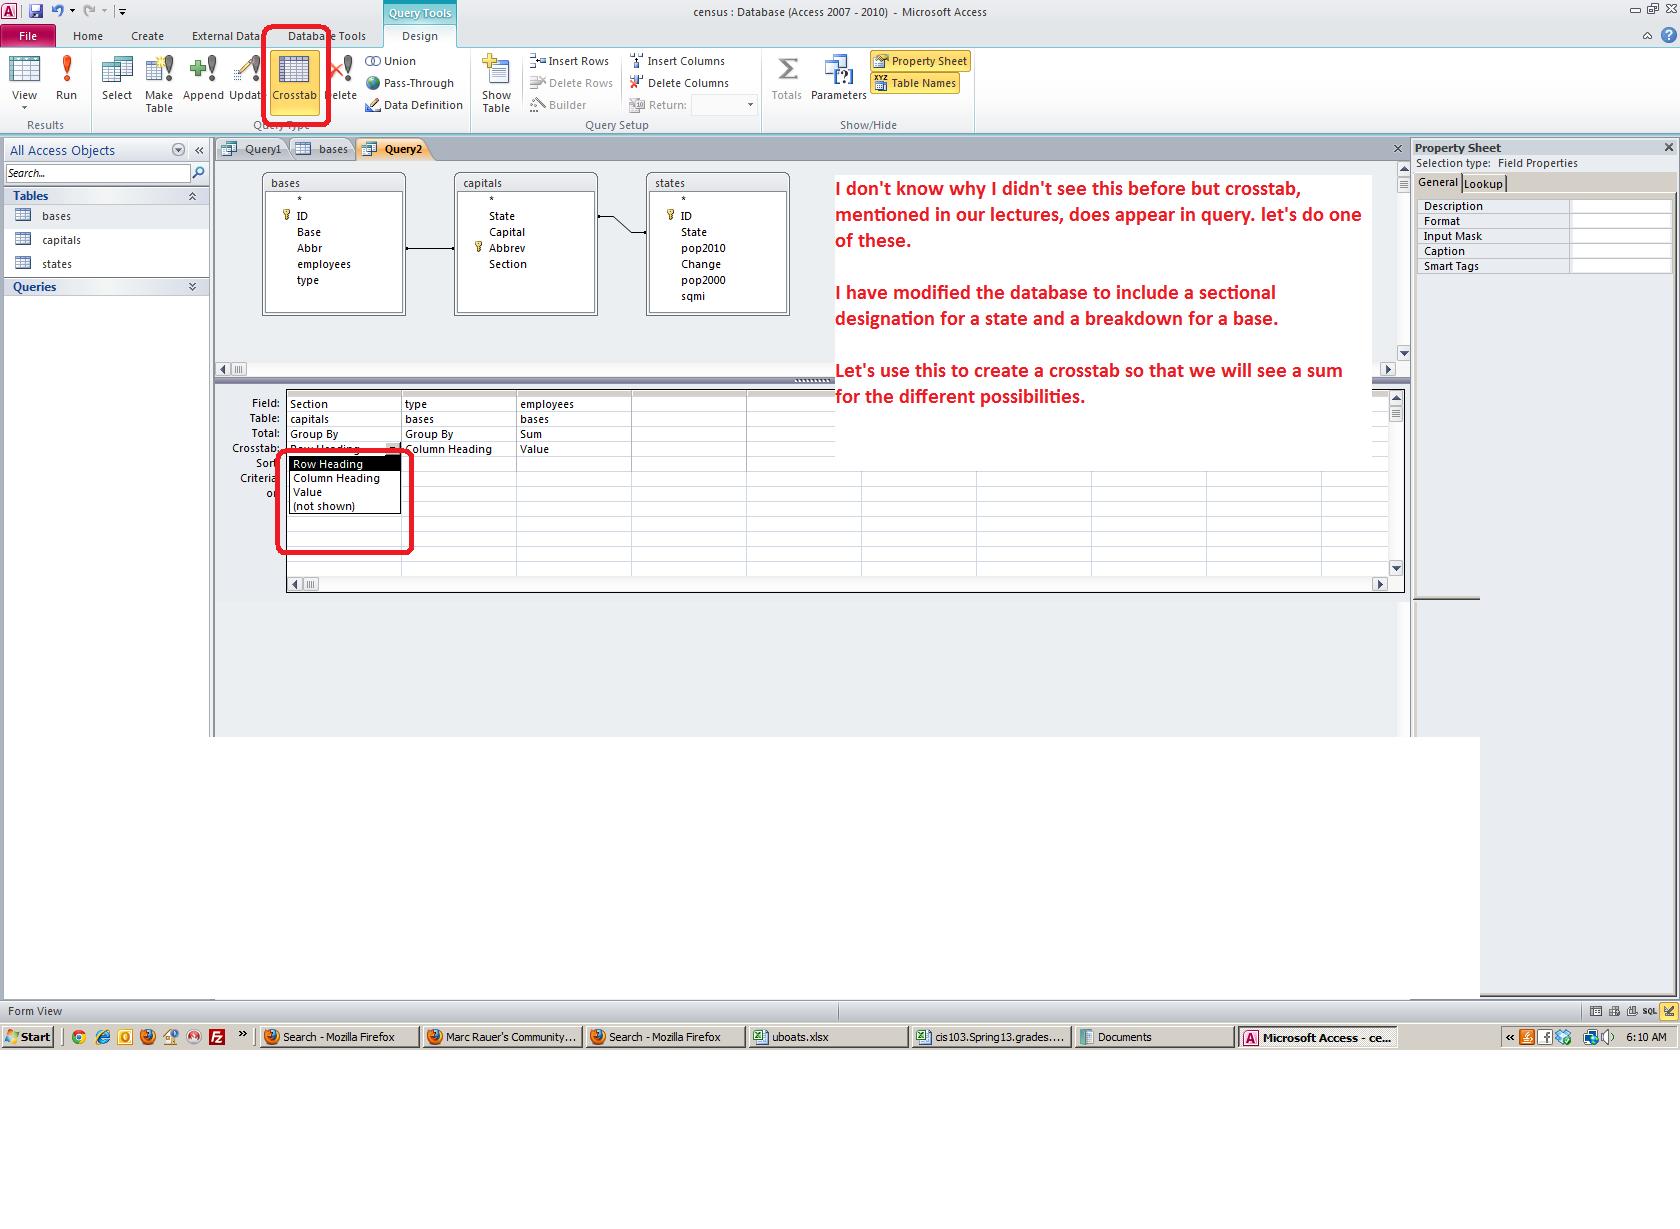
I don't know if this was in Access 2007, but I do notice that Access 2010 contains a crosstab option. I have been experimenting with this and I think we can do it in class. The following images below show the creation of a croostab. Here's the first showing how QBE deals with this.
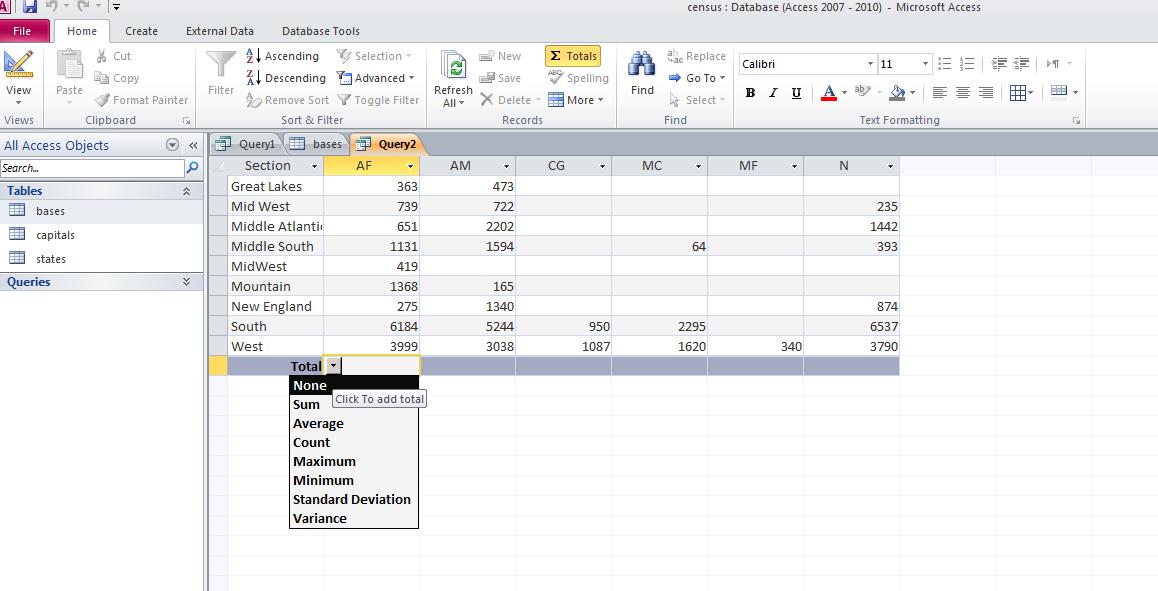
Below is the result. Notice that there are no totals. Totals can be set in similar manner that you will see in Excel table structure. It is inconvenient to have to set each column independently of course.
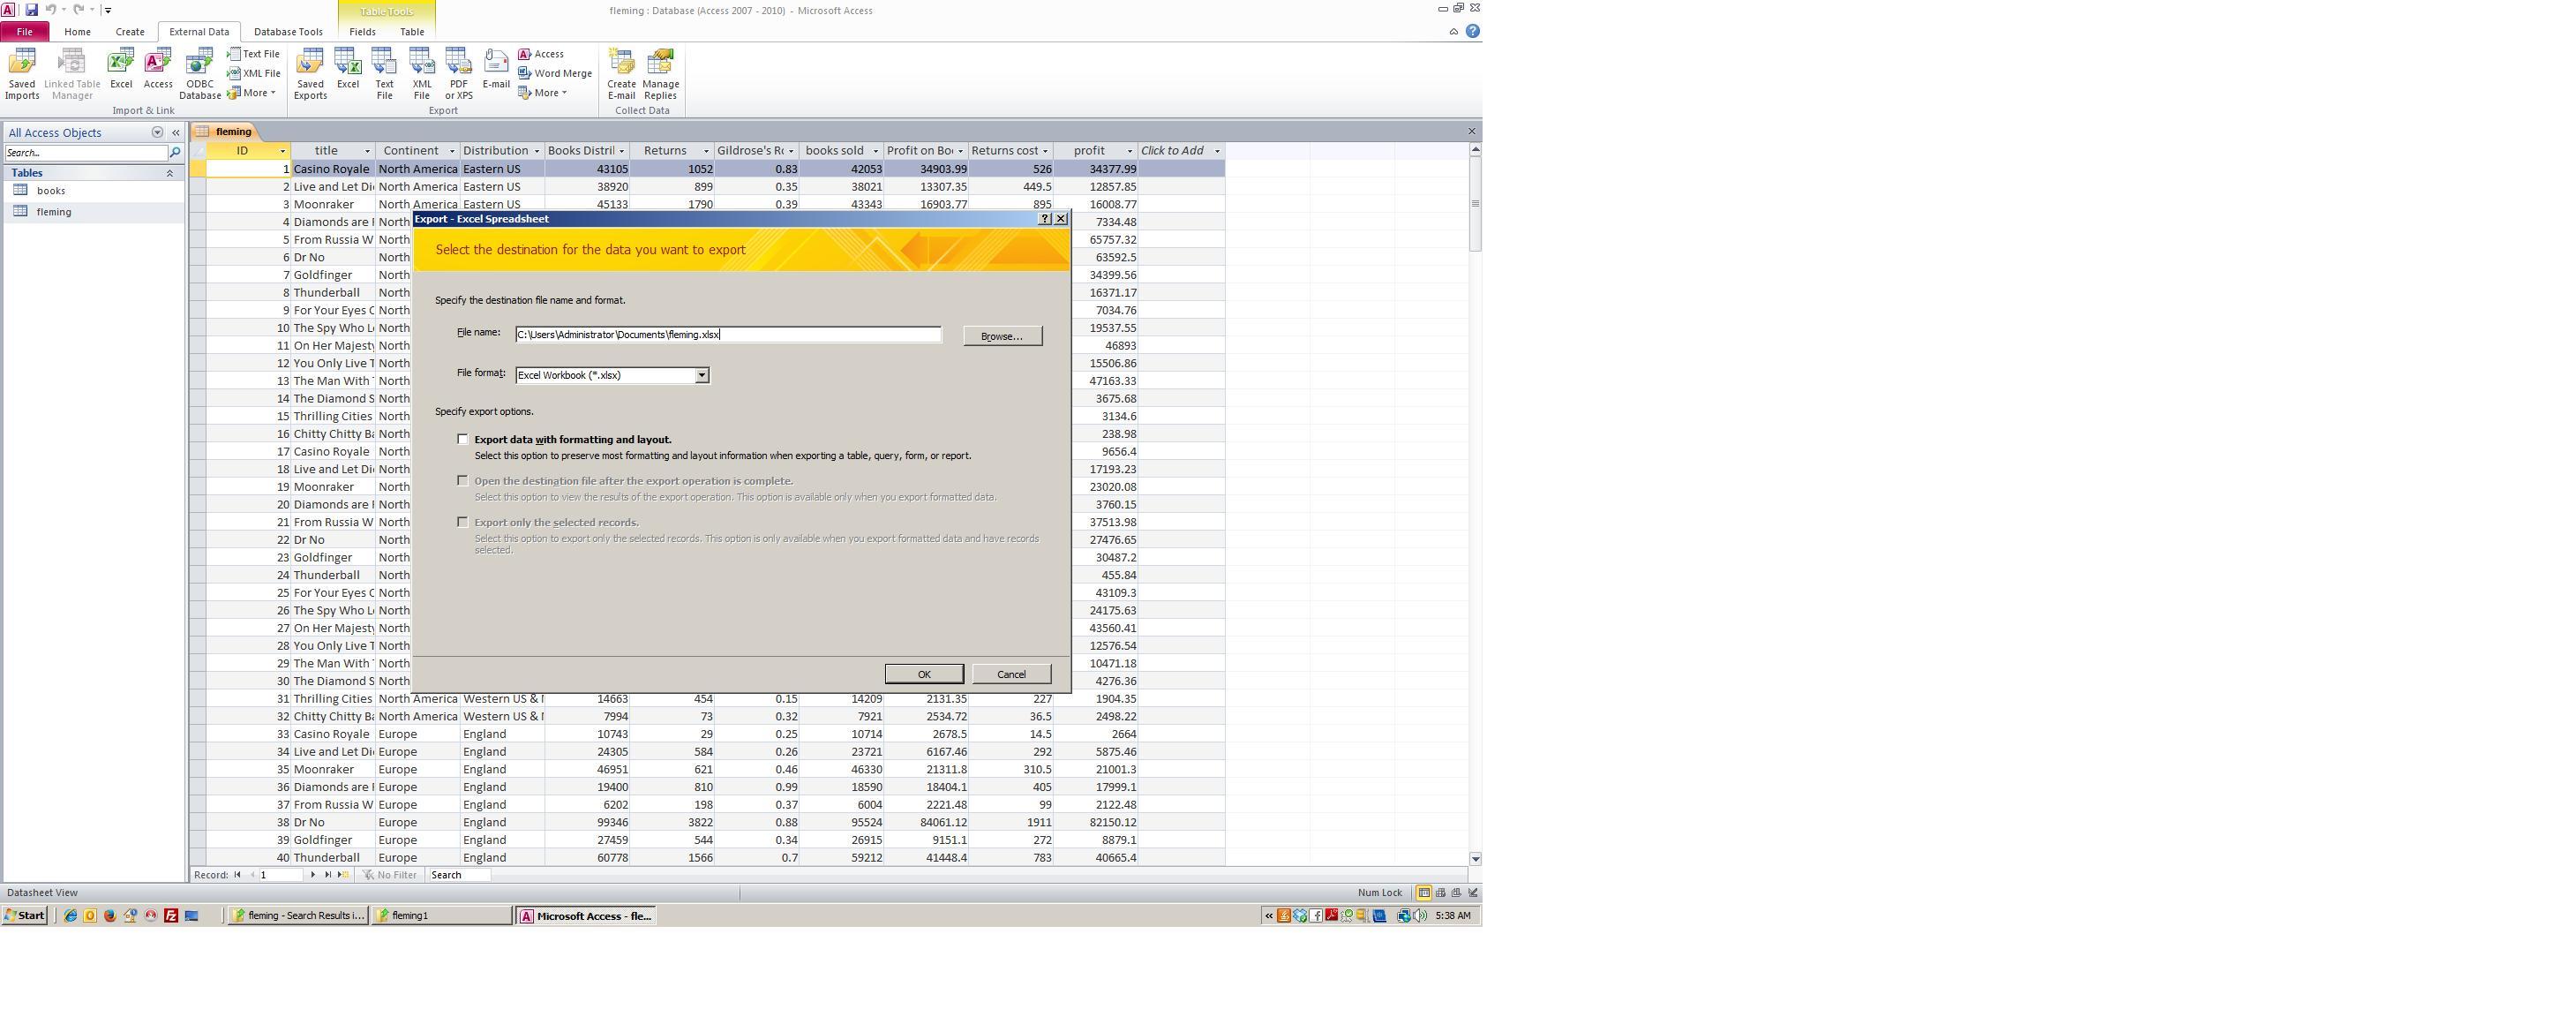
 Once we are done with our census problem, let's try one more problem. I have modified a problem we will do in excel as access. Load up the fleming database by clicking here. This is an access database with one table designated as fleming. Below is a picxture of the table.
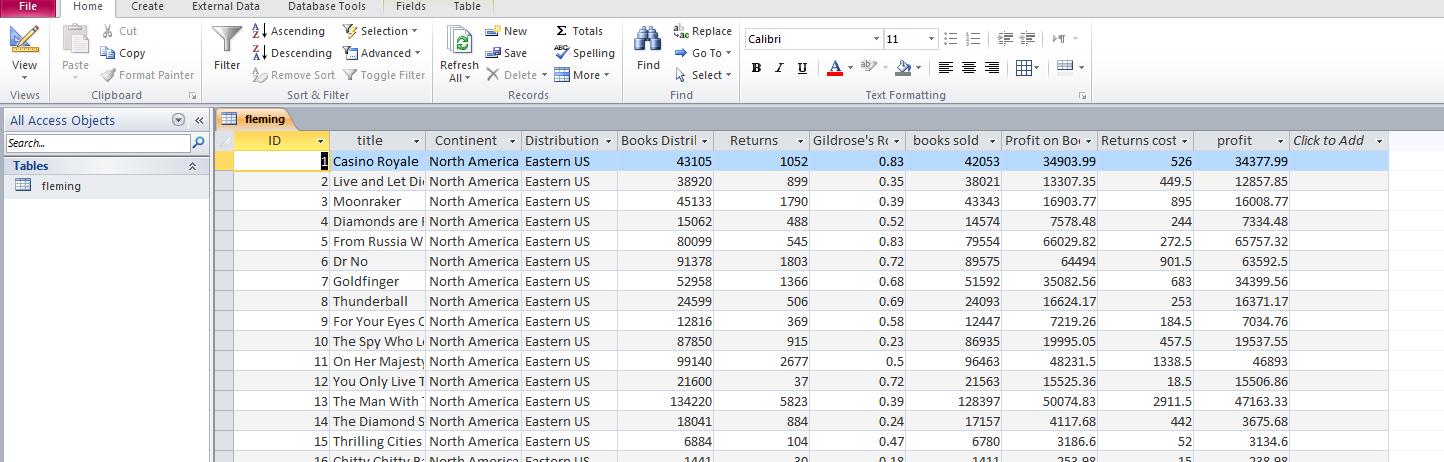
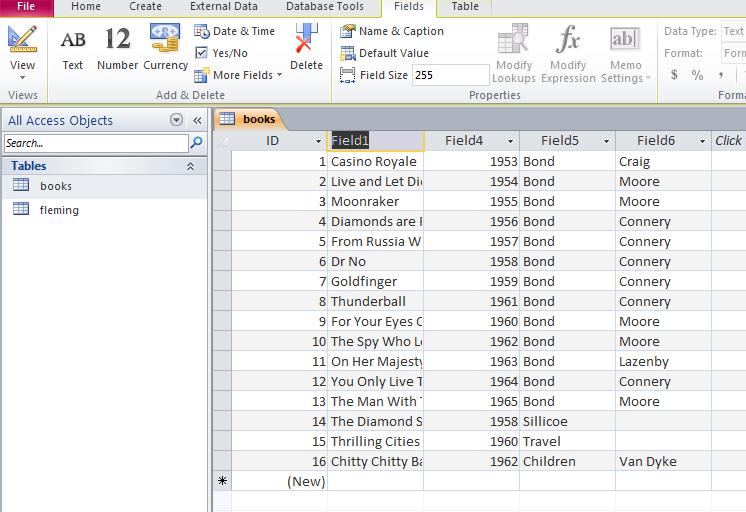
We have some data on the fourth sheet of an excel spreadsheet. We want to bring this info into access as a table. We can access the excel spreadsheet, flemingx.xlsx, by clicking here.
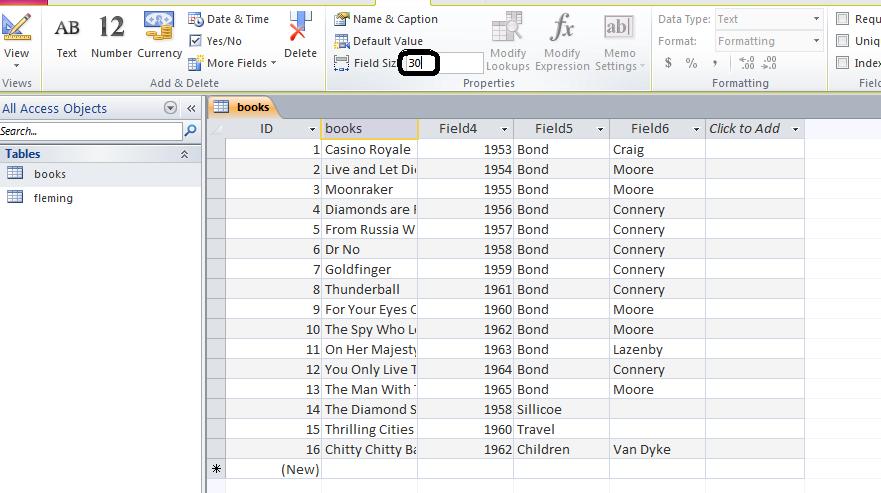
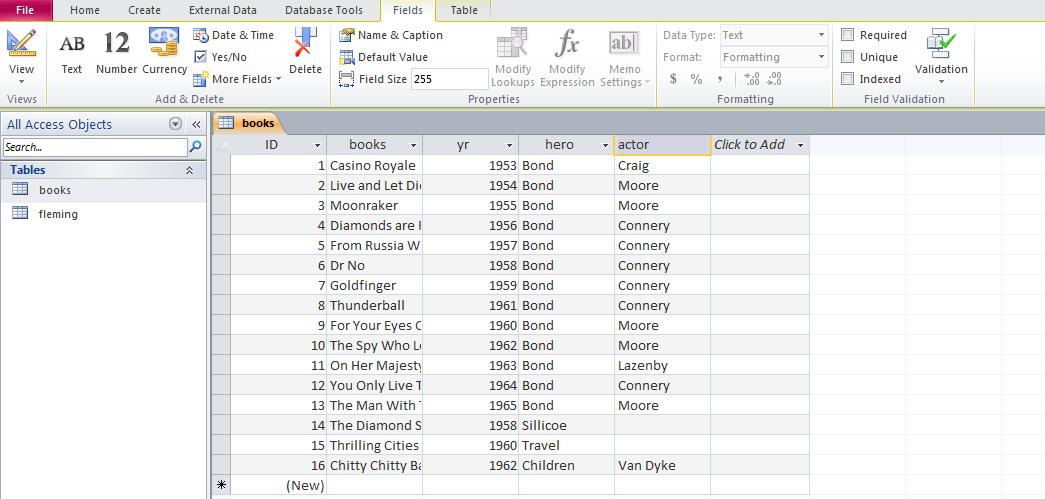
For this data, there is no header line. Access will default to field0, field1, etc. Let's make some changes only using datasheet view. Below, we see changes to name of field and changes to length of field.
Below, you can see what this looks like when done. We've stayed in datasheet view although this, obviously, could have been done in design view.
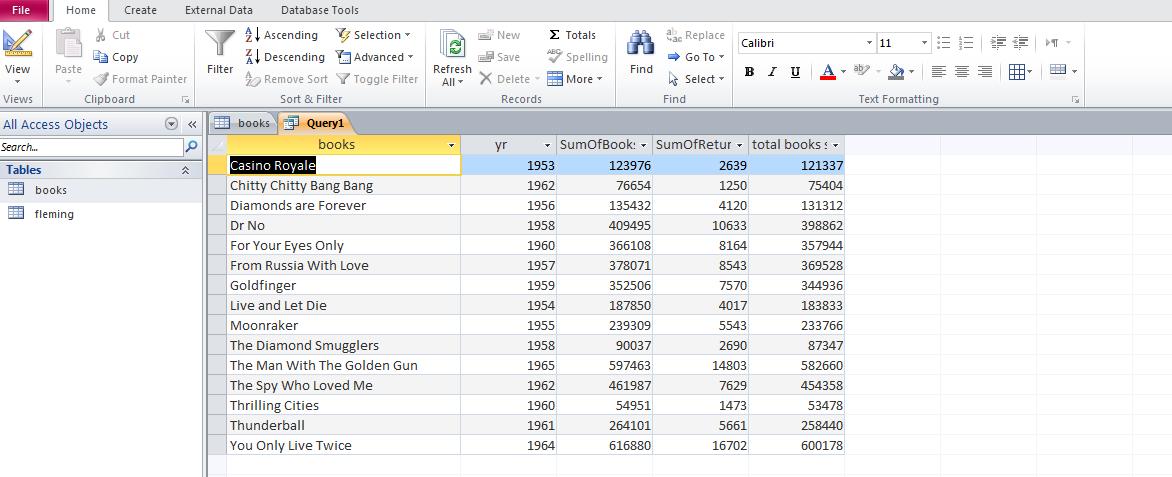
Now, we want to link the two tables. Name of book (title in one, book in the other) is the obvious choice. In doing this link we are doing a many to one situation. Now, once the link is done, we want to determine for each book title, the year of publication (book table), amount of books distributed and returns (sums calculated through the fleming table) and a calculated sum - subtraction of the two totals. Below is how we set this up.
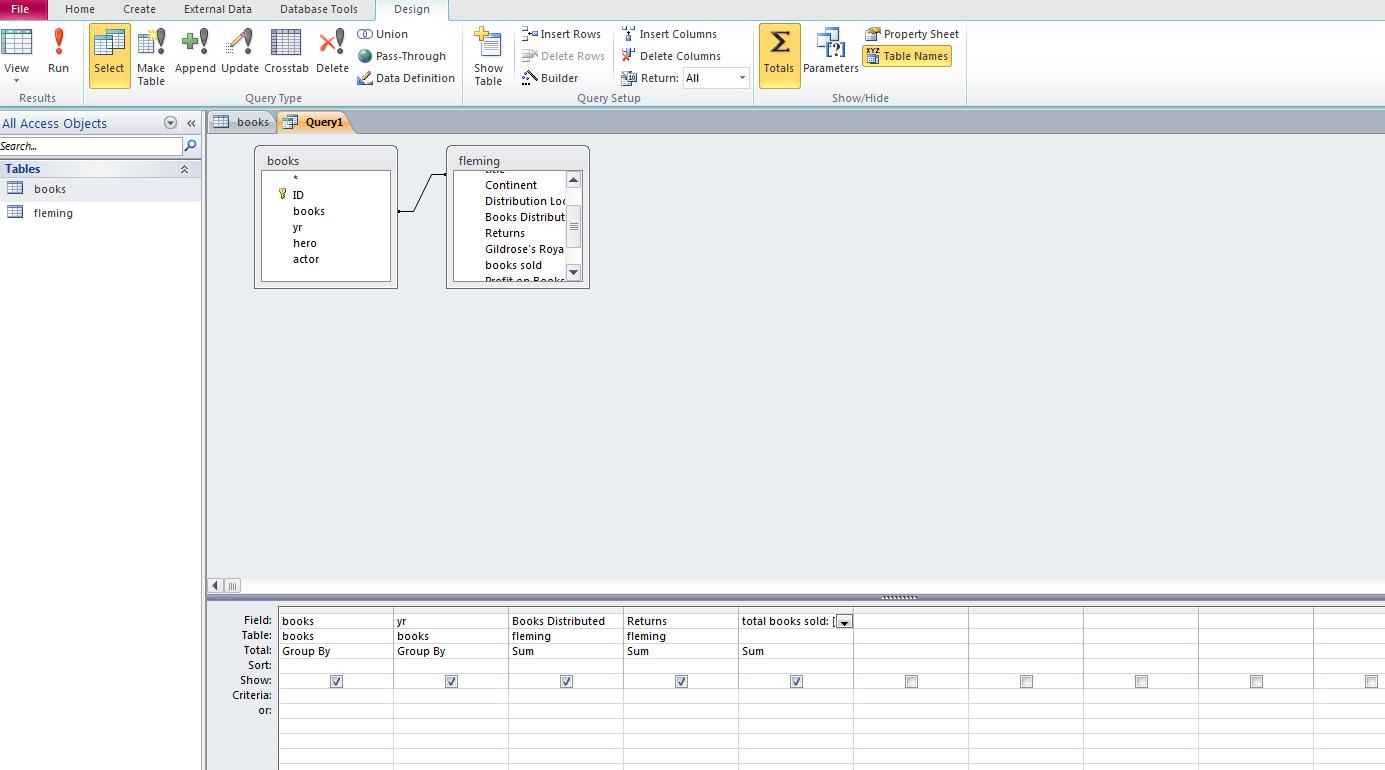
Here's the calculation results
Let's start by loading the "people" database by clicking here. We'll start from here.
The next two images show you what the database looks like.
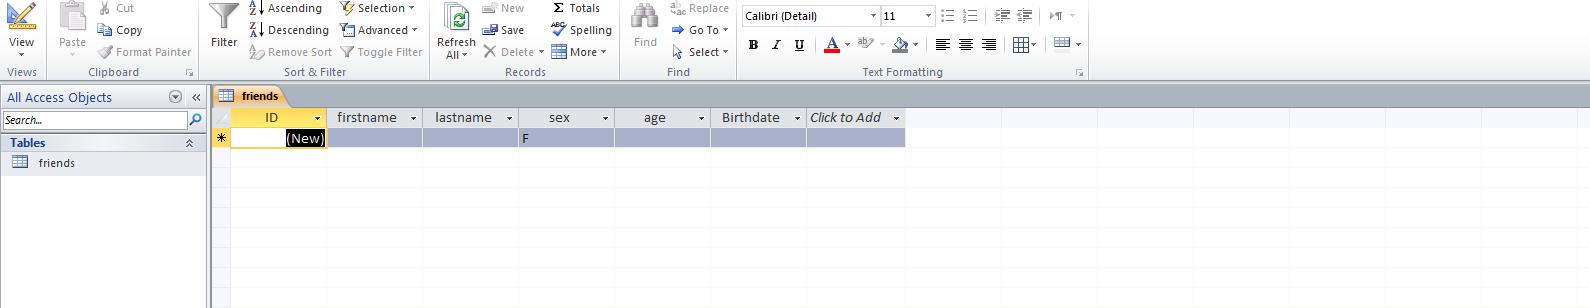

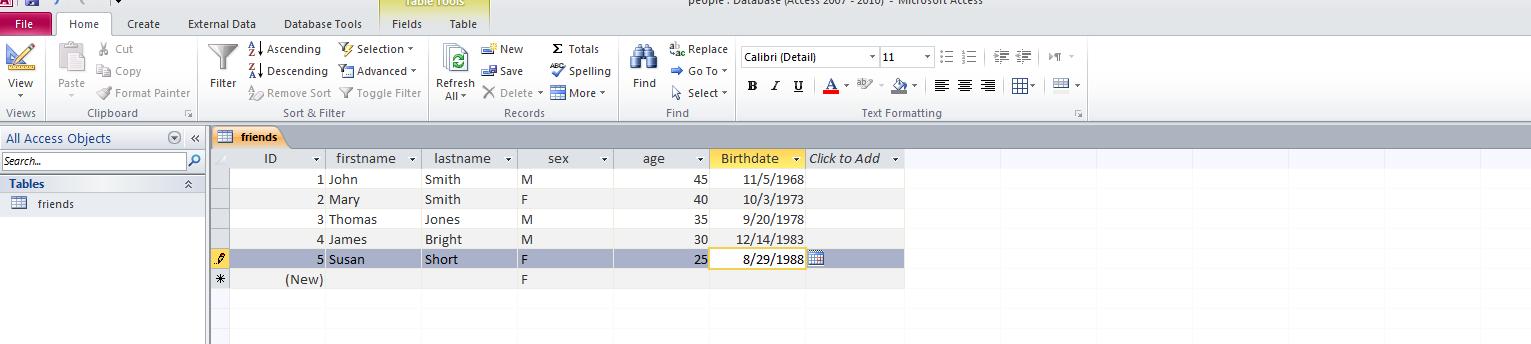
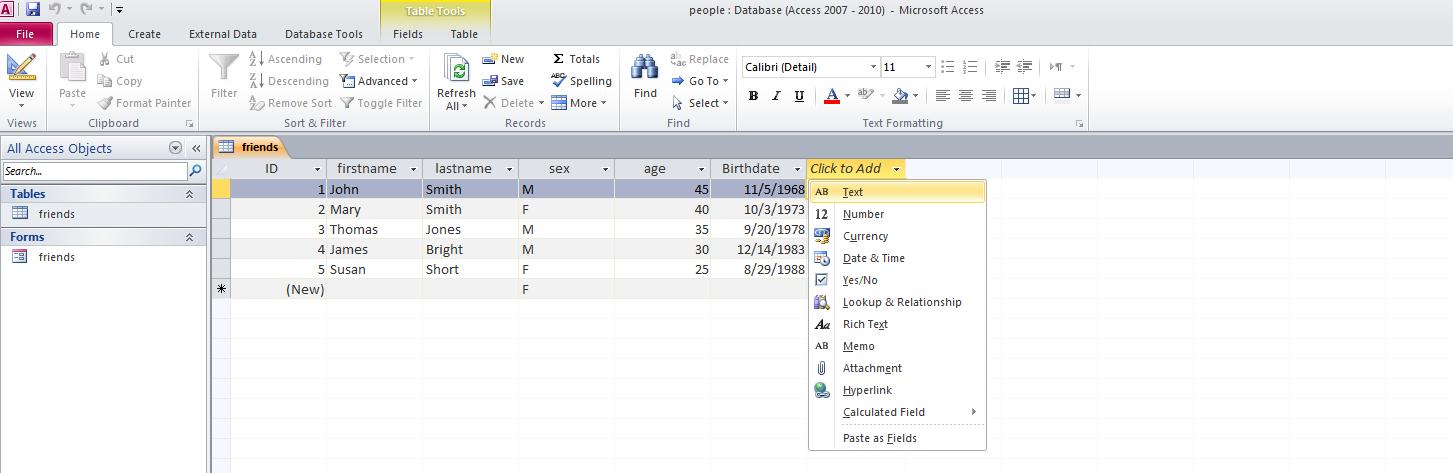
Although we put data in the database for the morning class, let's all enter the follwong data:
John Smith      M   45  11/5/1968
Mary Smith      F   40  10/3/1973
Thomas Jones    M   35  9/20/1978
James Bright    M   30  12/14/1983
Susan Short     F   25  8/29/1988
After filling these in, we should see something that looks like the following
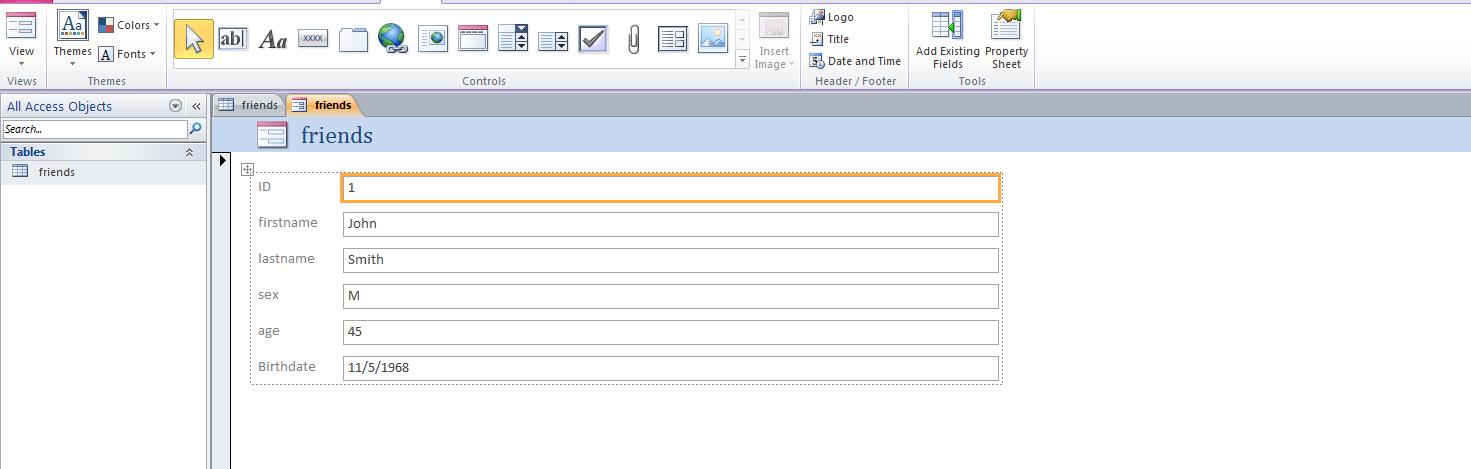
Let's create a form for this table. Enter create and ask for form design. Since we are on the friends table, the form created will be for Friends. Here it is below:
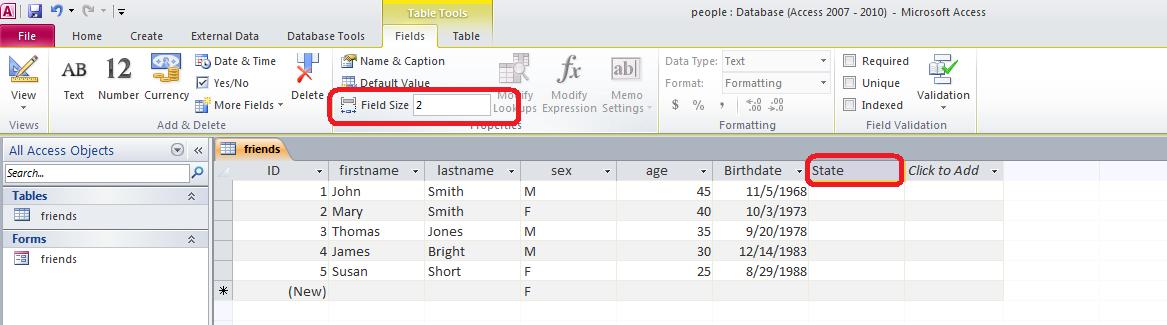
Let's add another field here. "State" for the state where our friends were born. The states are respectively PA,NJ,NY,OH,PA. Let's enter a new field for the state but in a different way. Go back to datasheet view.
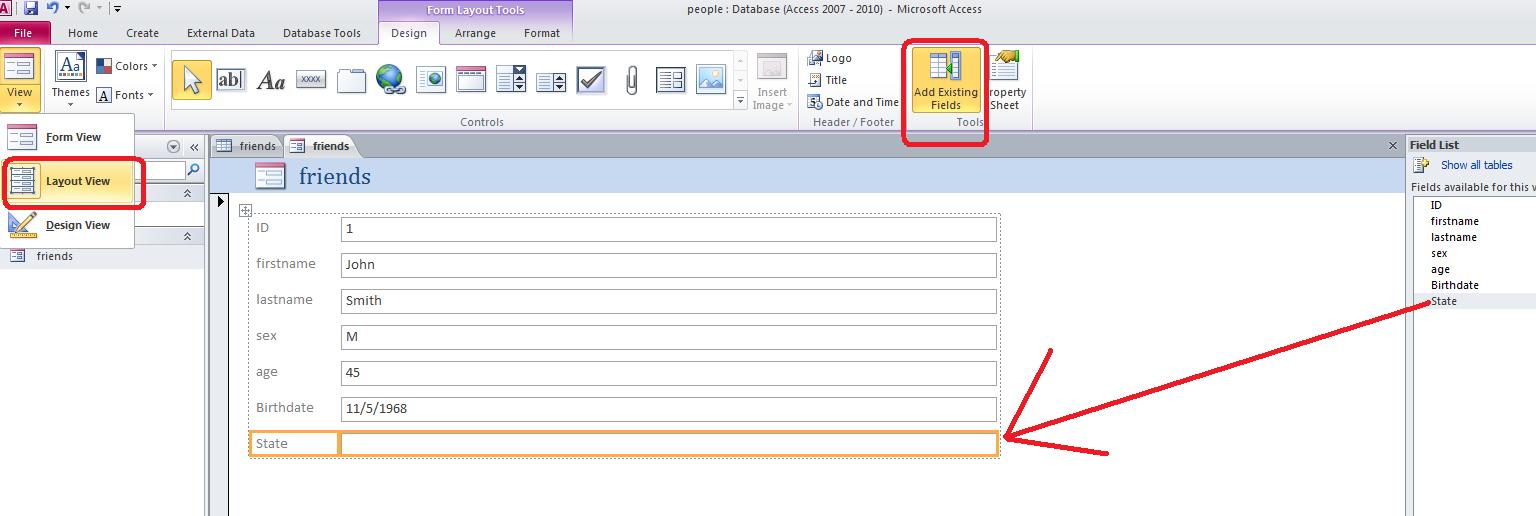
Let's use our form to enter this data. Notice that the form has not changed. We need to add state to our fields. In form go to layout view, click add existing fields and drag state to the tableau.
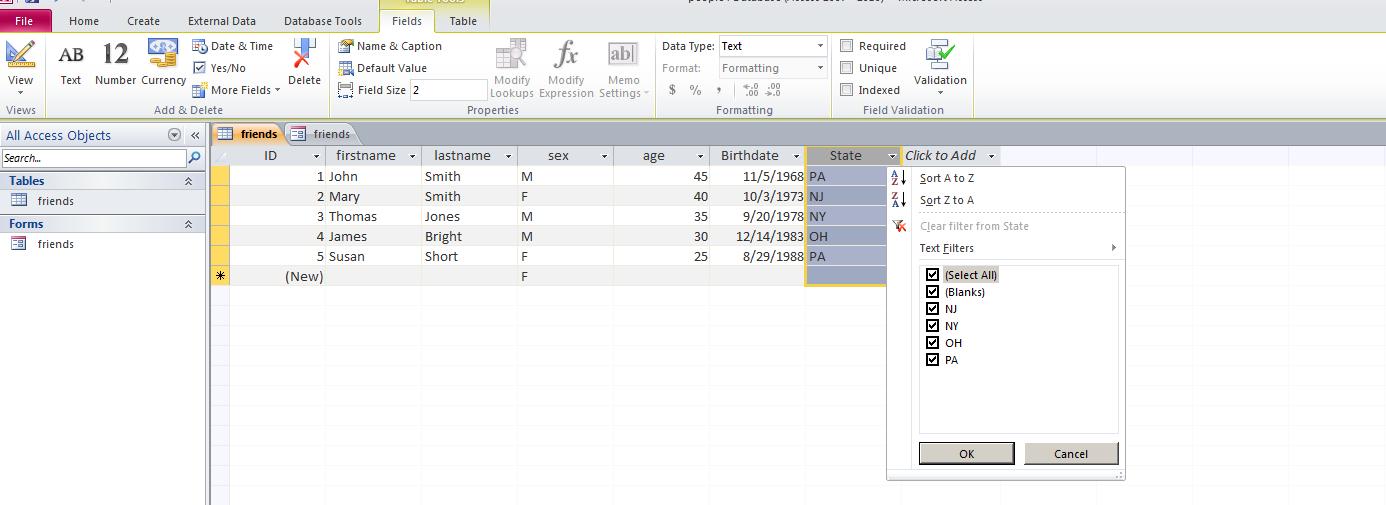
Let's get back to the table. We can do limited work with this in what is termed as filtering. You can sort by the type of the field. You can see the unique entries in the field and you can find entries by condition. Below is the example for the State field.
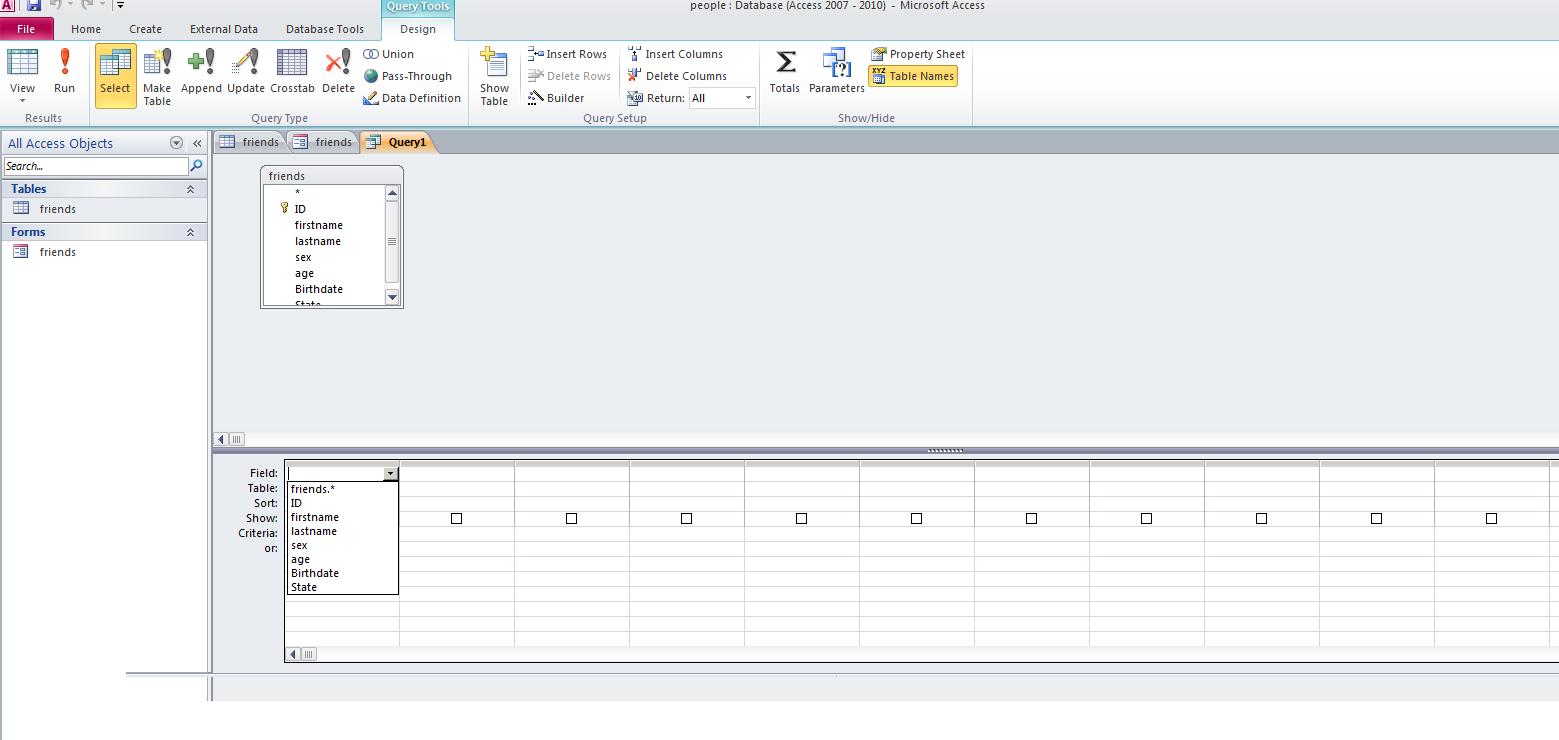
Filter is what database people would call a quick use of query. This is our next line of attack. Go to Create, then query design. The query tab will show a dialog box where you can click add for the table friends
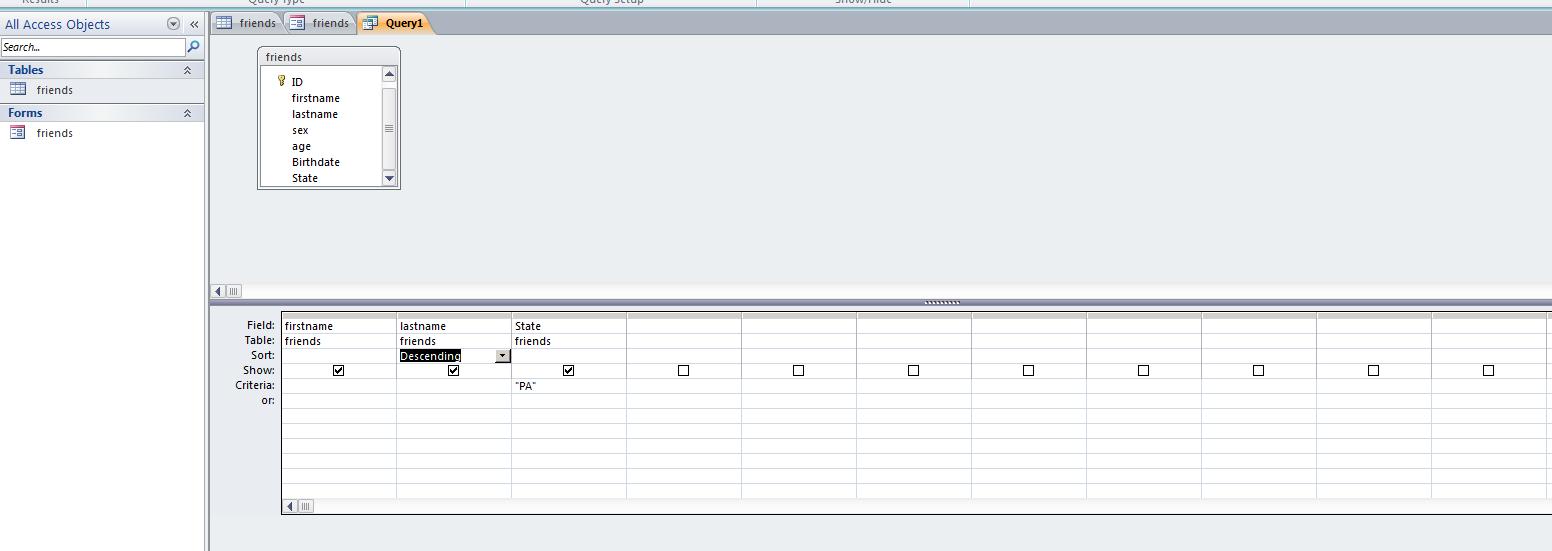
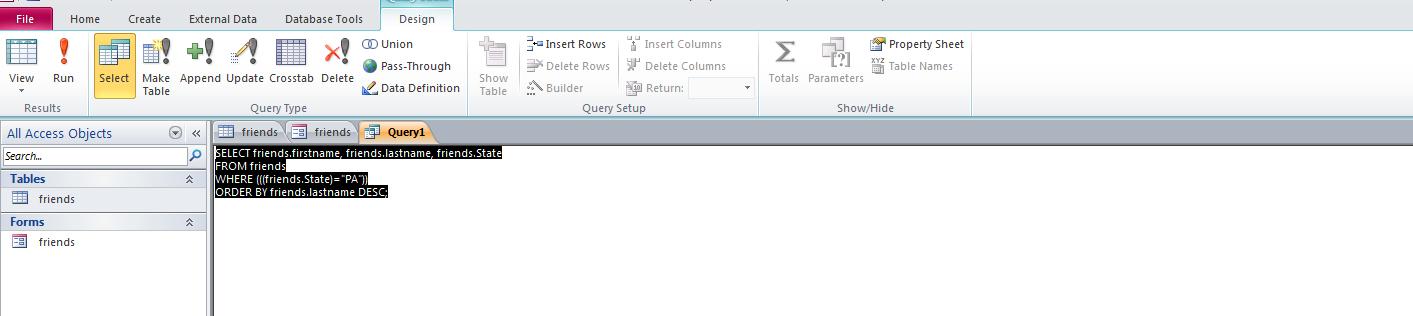
There is plenty to discuss as far as query is concerned. It takes filter and extends it. We will do examples of listing, sorting, and extraction. Below is an example of listing the first name, lastname and state in reverse lastname order for those born in PA.
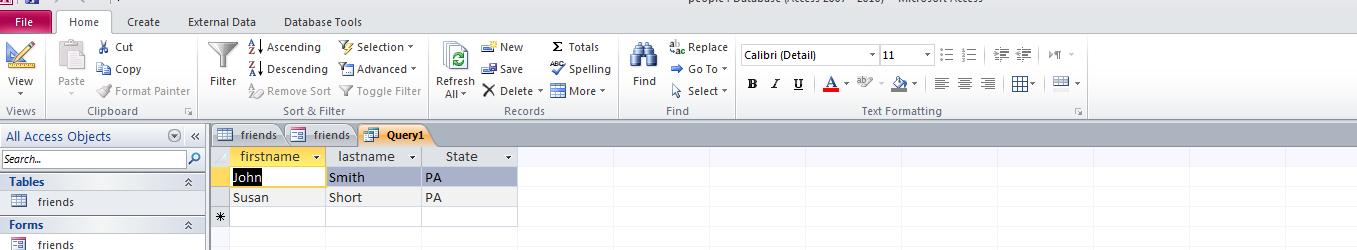
Now, click the red exclamation mark and here's the result.
What you are running is called query by example (QBE). Relational databases run on a language called SQL. Access automatically translates between the two. Click view, SQL view and you will see the following:
Ready to expand this. Relational databases are very powerful. That power comes in the definition of relationships. There are some 5 normalizations which a database designer is supposed to go through to make the database the most efficient. Let's look at the new state field. Couldn't we make this more efficient. Let's create a second table designated as state consisting on two fields: number and state abbr. Here's how this looks:
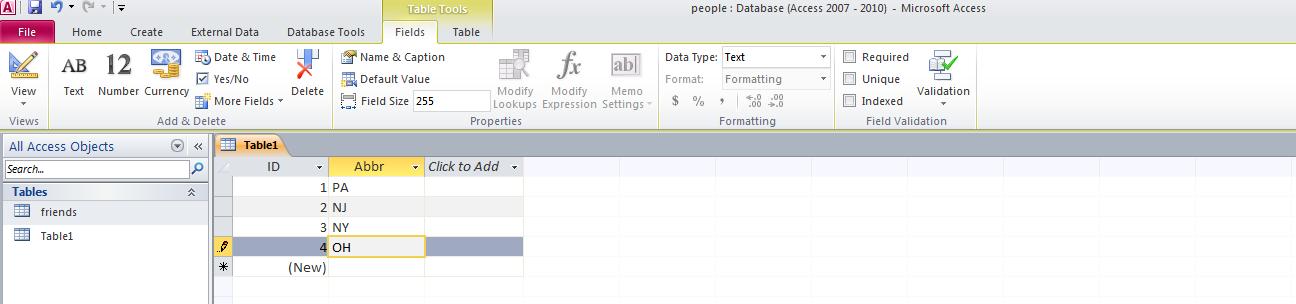
Let's change the first table. Set Pa to 1, NJ to 2, NY to 3, Oh to 4. Change the type to number which will automatically change the numbered text to real numbers.
Let's try another example.
This week we start our discussions of Access, a relational database. Your instructor will attempt to explain what is a database and what we mean by relational database.
We are going to create a database and this database will start with one table only. Below, we show screen shots of the creation of this database and table.
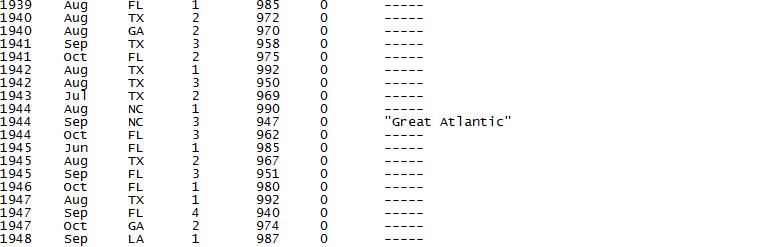
Year	Month	States	Safir-	Max	Max.   	Name
		Affected	Simpson 	Pressure	Winds
			Category 	(mb)	(kt)

1851	Jun	TX	1	974	80	-----
1851	Aug	FL	3	955	100	"Great Middle Florida"
1852	Aug	AL	3	961	100	"Great Mobile"
1852	Sep	FL	1	982	70	-----
1852	Oct	FL	2	965	90	"Middle Florida"
1853	Oct   	GA	1	965	70	-----
1854	Jun	TX	1	982	70	-----
1854	Sep	GA	3	950	100	"Great Carolina"
1854	Sep	TX	2	965	90	"Matagorda"
1855	Sep	LA	3	945	110	"Middle Gulf Shore"
1856	Aug	LA	4	934	130	"Last Island"
1856	Aug	FL	2	965	90	"Southeastern States"
1857	Sep   	NC	2	961	90	-----
1858	Sep	NY	1	976	80	"New England"
1859	Sep	AL	1	982	70	-----
1859	Oct	FL	1	974	80	-----
1860	Aug	LA	3	945	110	-----
1860 	Sep	LA	2	965	90	-----
1860	Oct	LA	2	965	90	-----
1861	Aug   	FL	1	978	70	"Key West"
1861	Sep	NC	1	985	70	"Equinoctial"
1861	Nov	NC	1	985	70	"Expedition"
1862 	None
1863	None
1864	None
1865	Sep	LA	2	965	90	"Sabine River"
1865	Oct	FL	2	969	90	-----
1866	Jul	TX	2	965	90	-----
1867	Jun	SC	1	985	70	-----
1867	Oct	LA	2	965	90	"Galveston"
1868	None
1869	Aug	TX	2	965	90	"Lower Texas Coast"
1869	Sep	LA	1	982	70	-----
1869	Sep	RI	3	963	100	"Eastern New England"
1869	Oct   	ME	2	965	90	"Saxby's Gale"
1870	Jul	AL	1	982	70	"Mobile"
1870	Oct   	FL	1	970	70	"Twin Key West (I)"
1870	Oct	FL	1	977	80	"Twin Key West (II)"
1871	Aug	FL	3	955	100	-----
1871	Aug	FL	2	965	90	-----
1871	Sep	FL	1	982	70	-----
1872 	None
1873	Sep	FL	1	982	70	-----
1873	Oct	FL	3	959	100	-----
1874	Sep	FL	1	981	80	-----
1875	Sep	TX	3	955	100	-----
1876	Sep	NC	1	980	80	-----
1876	Oct	FL	2	973	90	-----
1877	Sep	LA	1	982	70	-----
1877	Oct	FL	3	955	100	-----
1878	Sep	FL	2	970	90	-----
1878	Oct	NC	2	963	90	-----
1879	Aug	NC	3	971	100	-----
1879	Aug	TX	2	964	90	-----
1879	Sep	LA	3	945	110	-----
1880	Aug   	TX	3	931	110	-----
1880	Aug	FL	2	972	90	-----
1880	Sep	NC	1	987	70	-----
1880	Oct	FL	1	982	70	-----
1881	Aug	GA	2	970	90	-----
1881	Sep	NC	2	975	90	-----
1882	Sep	FL	3	949	110	-----
1882	Oct	FL	1	985	70	-----
1883	Sep	NC	2	965	90	-----
1884	None
1885	Aug	SC	2	970	90	-----
1886	Jun	TX	2	970	85	-----
1886	Jun	FL	2	970	85	-----
1886	Jun	FL	2	970	85	-----
1886	Jul	FL	1	982	70	-----
1886	Aug	TX	4	925	130	"Indianola"
1886	Sep   	TX	1	973	80	-----
1886	Oct	LA	3	950	105	-----
1887	Jul	FL	1	978	75	-----
1887	Aug   	NC	1	946	65	-----
1887	Sep	TX	1	973	75	-----
1887	Oct	LA	1	978	75	-----
1888	Jun	TX	1	982	70	-----
1888	Aug	FL	3	945	110	-----
1888	Sep   	MA	TS	985	55	-----
1888	Oct	FL	2	970	95	-----
1889	Sep	LA	1	982	70	-----
1890	None
1891	Jul	TX	1	974	80	-----
1891	Aug	FL	1	985	70	-----
1892	None
1893	Aug	NY	1	986	75	"Midnight Storm"
1893	Aug	GA	3	954	100	"Sea Islands"
1893	Sep	LA	2	970	85	-----
1893	Oct	LA	4	948	115	"Chenier Caminanda"
1893	Oct	SC	3	955	105	-----
1894	Sep	FL	2	975	90	-----
1894	Oct	FL	3	950	105	-----
1895	Aug   	TX	1	963	65	-----
1896	Jul	FL	2	970	85	-----
1896	Sep	RI	1	985	70	-----
1896	Sep	FL	3	960	110	-----
1897	Sep	LA	1	978	75	-----
1898	Aug	FL	1	982	70	-----
1898	Aug	GA	1	980	75	-----
1898	Oct	GA	4	938	115	-----
1899	Aug	FL	2	979	85	-----
1899	Aug	NC	3	945	105	-----
1899	Oct	NC	2	955	95	-----
1900	Sep	TX	4	936	120	"Galveston"
1901	Jul	NC	1	983	70	-----
1901	Aug	LA	1	973	75	-----
1902 	None
1903	Sep	FL	1	974	80	-----
1903	Sep	NJ	1	990	70	-----
1904	Sep	SC	1	985	70	-----
1904	Oct	FL	1	985	70	-----
1905	None
1906	Jun	FL	1	979	75	-----
1906	Sep	SC	1	977	80	-----
1906	Sep	MS	2	958	95	-----
1906	Oct	FL	3	953	105	-----
1907	None
1908	May   	NC	TS	989	55	-----
1908	Jul	NC	1	985	70	-----
1909	Jun	TX	2	972	85	-----
1909	Jul	TX	3	959	100	"Velasco"
1909	Aug   	TX	1	955	65	-----
1909	Sep	LA	3	952	105	"Grand Isle"
1909	Oct	FL	3	957	100	-----
1910	Sep	TX	2	965	90	-----
1910	Oct	FL	2	955	95	-----
1911 	Aug 	FL	1 	982 	70  	-----
1911 	Aug 	SC	2 	972 	85  	-----
1912 	Sep 	AL	1	986 	65  	-----
1912 	Oct 	TX	2 	970 	85  	-----
1913 	Jun 	TX	1 	986 	65  	-----
1913 	Sep 	NC	1 	976 	75  	-----
1913 	Oct 	SC	1 	989 	65  	-----
1914	None
1915	Aug	FL	1	990	65	-----
1915	Aug	TX	4	940	115	"Galveston"
1915	Sep	FL	1	982	80	-----
1915	Sep	LA	3	944	110	"New Orleans"
1916	Jul	MS	3	950	105	-----
1916	Jul	SC	2	960	95	-----
1916	Aug	TX	4	932	115	-----
1916	Oct	AL	2	970	95	-----
1917	Sep	FL	3	949	100	-----
1918	Aug	LA	3	955	105	-----
1918	Aug	NC	1	988	65	-----
1919	Sep	FL	4	927	130	-----
1920	Sep	LA	2	975	85	-----
1921	Jun	TX	1	980	80	-----
1921	Oct	FL	3	958	100	"Tampa Bay"
1922	None
1923	Oct	LA	1	983	70	-----
1924	Aug   	NC	1	963	65	-----
1924	Sep	FL	1	980	75	-----
1924	Oct	FL	1	975	80	-----
1925	None
1926	Jul	FL	2	967	90	-----
1926	Aug	LA	3	955	100	-----
1926	Sep	FL	4	930	125	"Great Miami"
1926	Oct   	FL	1	949	75	-----
1927	None
1928	Aug	FL	2	977	85	-----
1928	Sep	FL	4	929	125	"Lake Okeechobee"
1929	Jun	TX	1	982	80	-----
1929	Sep	FL	3	948	100	-----
1930	None
1931 	None
1932	Aug	TX 	4	935	130	"Freeport"
1932	Sep	AL	1	979	75	-----
1933	Jul 	TX        	1	975	80	-----
1933	Aug	NC	1	963	80	-----
1933	Sep	TX	3	940	110	-----
1933	Sep	FL	3	948	110	-----
1933	Sep  	NC	2	952	85	-----
1934	Jun	LA	2	966	85	-----
1934	Jul	TX	1	979	75	-----
1934	Sep  	NC	1               	975	65	-----
1935	Sep	FL	5	892	160	"Labor Day"
1935	Nov	FL	2	965	85	-----
1936	Jun	TX	1	987	-----	-----
1936	Jul	FL	3	964	-----	-----
1936	Sep	NC	2	-----	-----	-----
1937	None
1938	Aug	LA	1	985	-----	-----
1938	Sep	NY	3	946	-----	"Great New England"
1939	Aug	FL	1	985	-----	-----
1940	Aug	TX	2	972	-----	-----
1940	Aug	GA	2	970	-----	-----
1941	Sep	TX	3	958	-----	-----
1941	Oct	FL	2	975	-----	-----
1942	Aug	TX	1	992	-----	-----
1942	Aug	TX	3	950	-----	-----
1943	Jul	TX	2	969	-----	-----
1944	Aug	NC	1	990	-----	-----
1944	Sep	NC	3	947	-----	"Great Atlantic"
1944	Oct	FL	3	962	-----	-----
1945	Jun	FL	1	985	-----	-----
1945	Aug	TX	2	967	-----	-----
1945	Sep	FL	3	951	-----	-----
1946	Oct	FL	1	980	-----	-----
1947	Aug	TX	1	992	-----	-----
1947	Sep	FL	4	940	-----	-----
1947	Oct	GA	2	974	-----	-----
1948	Sep	LA	1	987	-----	-----
1948	Sep	FL	3	963	-----	-----
1948	Oct	FL	2	975	-----	-----
1949	Aug   	NC	1	980	-----	-----
1949	Aug	FL	3	954	-----	-----
1949	Oct	TX	2	972	-----	-----
1950	Aug	AL	1	980	-----	Baker
1950	Sep	FL	3	958	-----	Easy
1950	Oct	FL	3	955	-----	King
1951	None
1952	Aug	SC	1	985	-----	Able
1953	Aug	NC	1	987	-----	Barbara
1953	Sep	ME	1	-----	-----	Carol
1953	Sep	FL	1	985	-----	Florence
1954	Aug	NY	3	960	-----	Carol
1954	Sep	MA	3	954	-----	Edna
1954	Oct	SC	4	938	-----	Hazel
1955	Aug	NC	3	962	-----	Connie
1955	Aug	NC	1	987	-----	Diane
1955	Sep	NC	3	960	-----	Ione
1956	Sep	LA	2	975	-----	Flossy
1957	Jun	TX	4	945	----- 	Audrey
1958	Sep	NC	3	946	-----   	Helene
1959	Jul	SC	1	993	-----	Cindy
1959	Jul	TX	1	984	-----	Debra
1959	Sep	SC	3	950	-----	Gracie
1960	Sep	FL	4	930	-----	Donna
1960	Sep	MS	1	981	-----	Ethel
1961	Sep	TX	4	931	-----	Carla
1962	None
1963	Sep	TX	1	996	-----	Cindy
1964	Aug	FL	2	968	-----	Cleo
1964	Sep	FL	2	966	-----	Dora
1964	Oct	LA	3	950	-----	Hilda
1964	Oct	FL	2	974	-----	Isbell
1965	Sep	FL	3	948	-----	Betsy
1966	Jun	FL	2	982	-----	Alma
1966	Oct	FL	1	983	-----	Inez
1967	Sep	TX	3	950	-----	Beulah
1968	Oct	FL	2	977	-----	Gladys
1969	Aug	LA	5	909	-----	Camille
1969	Sep	ME	1	980	-----	Gerda
1970	Aug	TX	3	945	-----	Celia
1971	Sep	LA	2	978	-----	Edith
1971	Sep	TX	1	979	-----	Fern
1971	Sep	NC	1	995	-----	Ginger
1972	Jun	FL	1	980	-----	Agnes
1973	None
1974	Sep	LA	3	952	-----	Carmen
1975	Sep	FL	3	955	-----	Eloise
1976	Aug	NY	1	980	-----	Belle
1977	Sep	LA	1	995	-----	Babe
1978	None
1979	Jul	LA	1	986	-----	Bob
1979	Sep	FL	2	970	-----	David
1979	Sep	AL	3	946	-----	Frederic
1980	Aug	TX	3	945	100	Allen
1981	None
1982	None
1983	Aug	TX	3	962	100	Alicia
1984	Sep   	NC	2	949	95	Diana
1985	Jul	SC	1	1003	65	Bob
1985	Aug	LA	1	987	80	Danny
1985	Sep	AL	3	959	100	Elena
1985	Sep	NC	3	942	90	Gloria
1985	Oct	LA	1	971	75	Juan
1985	Nov	FL	2	967	85	Kate
1986	Jun	TX	1	990	75	Bonnie
1986	Aug	NC	1	990	65	Charley
1987	Oct	FL	1	993	65	Floyd
1988	Sep	LA	1	984	70	Florence
1989	Aug	TX	1	986	70	Chantal
1989	Sep	SC	4	934	120	Hugo
1989	Oct	TX	1	983	75	Jerry
1990	None
1991	Aug	RI	2	962	90	Bob
1992	Aug	FL	5	922	145	Andrew
1993	Aug  	NC	3	961	100	Emily
1994	None
1995	Aug	FL	2	973	85	Erin
1995	Oct	FL	3	942	100	Opal
1996	Jul	NC	2	974	90	Bertha
1996	Sep	NC	3	954	100	Fran
1997	Jul	LA	1	984	70	Danny
1998	Aug	NC	2	964	95	Bonnie
1998	Sep	FL	1	987	70	Earl
1998	Sep	FL	2	964	90	Georges
1999	Aug	TX	3	951	100	Bret
1999	Sep	NC	2	956	90	Floyd
1999	Oct 	FL	2	964	95	Irene
2000	None
2001	None
2002	Oct	LA	1	963	80	Lili
2003	Jul	TX	1	979	80	Claudette
2003	Sep	NC	2	957	90	Isabel
2004	Aug   	NC	1	972	70	Alex
2004	Aug	FL	4	941	130	Charley
2004	Aug	SC	1	985	65	Gaston
2004	Sep	FL	2	960	90	Frances
2004	Sep	AL	3	946	105	Ivan
2004	Sep	FL	3	950	105	Jeanne
2005	Jul	LA	1	991	65	Cindy
2005	Jul	FL	3	946	105	Dennis
2005	Aug	FL	3	920	110	Katrina
2005	Sep 	NC	1	982	65	Ophelia
2005	Sep	FL	3	937	100	Rita
2005	Oct	FL	3	950	105	Wilma
2007	Sep	TX	1	985	80	Humberto
2008	Jul	TX	1	967	75	Dolly
2008	Sep	LA	2	954	90	Gustav
2008	Sep	TX	2	950	95	Ike
2009	None
2010	None
2011	Aug	NC	1	952	75	Irene
Now, we can access this as a text file by clicking here. But, just in looking at the data, let's make some observations per this data. In both Access and Excel, we would like consistency per the columns. Access demands this. For Excel, it would be nice. Do you see any points of inconsistency.
How about the whole table. Certain years indicate none. Those records have completely inconsistent information. How about the years from 1936 through 1980 where wind speeds are not entered for some reason.
Right here we have a problem per Access. Access demands consistency per data in a column (and consider that the first three rows indicate column headers). Columns can be numeric and there are various types of numbers allowed including integers and floating points, which we will explain. Automatic numbering is another possible type of column possibility. Text (also designated as string) is another type of column and something designated as Yes/NO (or True/False) is another. Notice that wind speed violates this need for consistency.
How about Hurricane name? ---- is as text oriented as 'lower texas coast' so this is not a problem. Buit, take a look at the Safir-Simpson category. TS (for tropical storm) cannot work with the numbers 1 through 5.
How will Access handle inconsistancies in data within a column. In the case of numerics, it sets everything to text. the number 65 can be entered as a number or text. If data is set as text, whether looking like numbers or not, numerical calculations cannot be done on the data. In class we will modify TS to represent 0 and use 0 in windspeed to represent -----.
Another need of Access which Excel doesn't need, is uniqueness. Each record must have a unique element to it as compared to another record. Do we have that here? Yes and no. It is probable that up to 1950 there was a difference somewhere is records whether by year, safir classification or pressure. After 1950 uniqueness is achieved through name and year. However, Access has the ability to assure uniqueness though automatic numbering which we will use.
Now, let's open Access. Access data file is designated as a database. A database can have a series of objects associated with it. One type of object is a table. A table is composed of a series of records having consistent columns. This is what we are talking about per this data, is it not.
Databases also have allowance for filtering and a cousin of filtering, queries. Filtering takes a table and shows results based on constrints. This is the and/or discussion of the librarians which makes sense since they were, in essence, discussing data bases. A query is a formalized way of filtering with other possibilities.
 Report and input functions also exist within a database designated as report and form. We will deal with form almost assuredy during our classes but I have questions whether we will have the time to look at reports in this class.
To start this process, we need to modify this text file. delete those years with none. let's change TS in the category to 0 and ---- is wind speed to 0.
Let's open Access. The first page pertains to databases already in existance. We are interested in creating a database. Just hit the create button. Once in this new database, designated as databasex.accdb, click on external data and start the process of bring in this text file as a table. We can start this as indicated below.
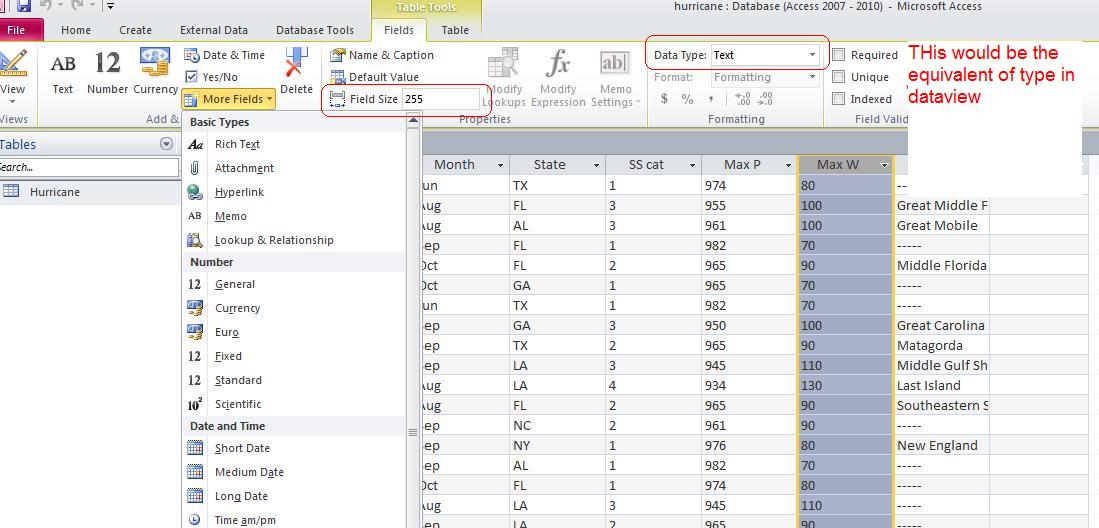
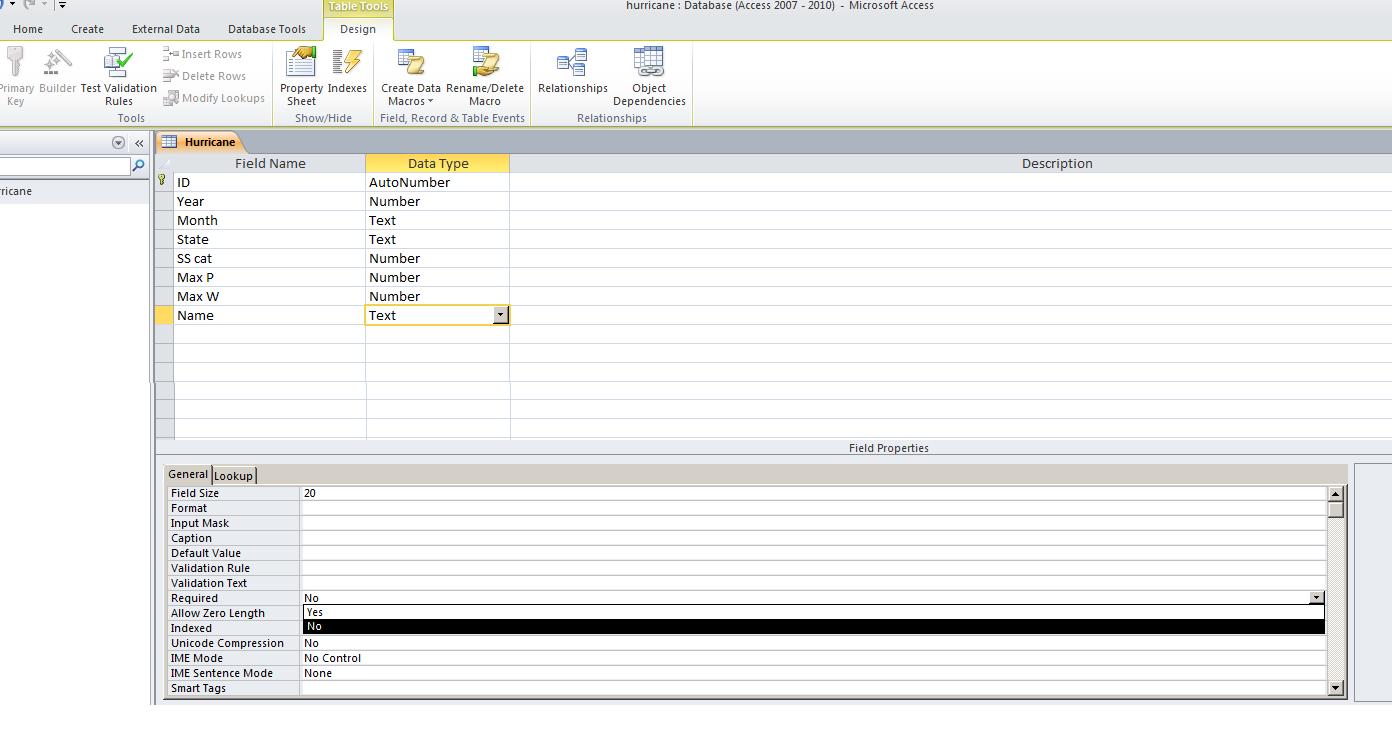
Once you have your table within the database, the comsistency of the fields (columns) can be changed in one of several ways. Either through the fields tab as shown below or through the change of view. Below, we see a start to changing field type either through more fields or data type
The image below looks at the month field. Clicking the control on the field header gives you some possibilities. These options are brought to you by MS office since this is beyond what is required by a relational database. So, within the datasheet view you can saort and filter. Notice in terms of filter, all the unique entries are displayed.
However, most Access users either though the need for more control or habit utilize the design view. Here we have two sections of control. Each field allows for type and then when the type is chosen a bottom section allows for choices pertaining to a specific type.
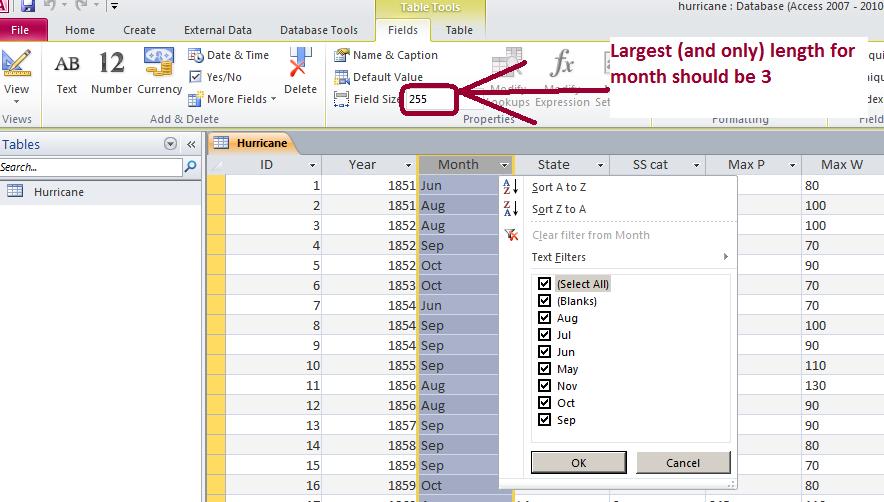
The image below shows the bottom section when text is chosen. Several of the bottom section options should be discussed. Obviously length is important as the default for this for any field is 255. if you need 3 characters to represent a month, 255 is wasting 252 characters per record. For a small datafile this may not be significant but when holding billions of records, it is quite significant just per a question of response and speed.
In addition, on all of this a default value is allowed. If records are being entered at all times, this makes it easier for the input operator not to mention having less errors.
Below that is the validation rule and validation text. The text is displayed if the rule is violated. Now, how do you handle a validation rule. Not much different that what the librarian would say. Remember the or statement discussed, We could handle this with a ="jan" or "feb" or "mar" or "apr" or "may" or "june" or "jul" or "aug" or "sep" or "oct" or "nov" or "dec". The equal sign is not required in Access (it is in Excel) and the or's allow for a variety of answers but keeping wrong answers from being entered. Another example would be ="M" or "F" for a field that required an answer to gender.
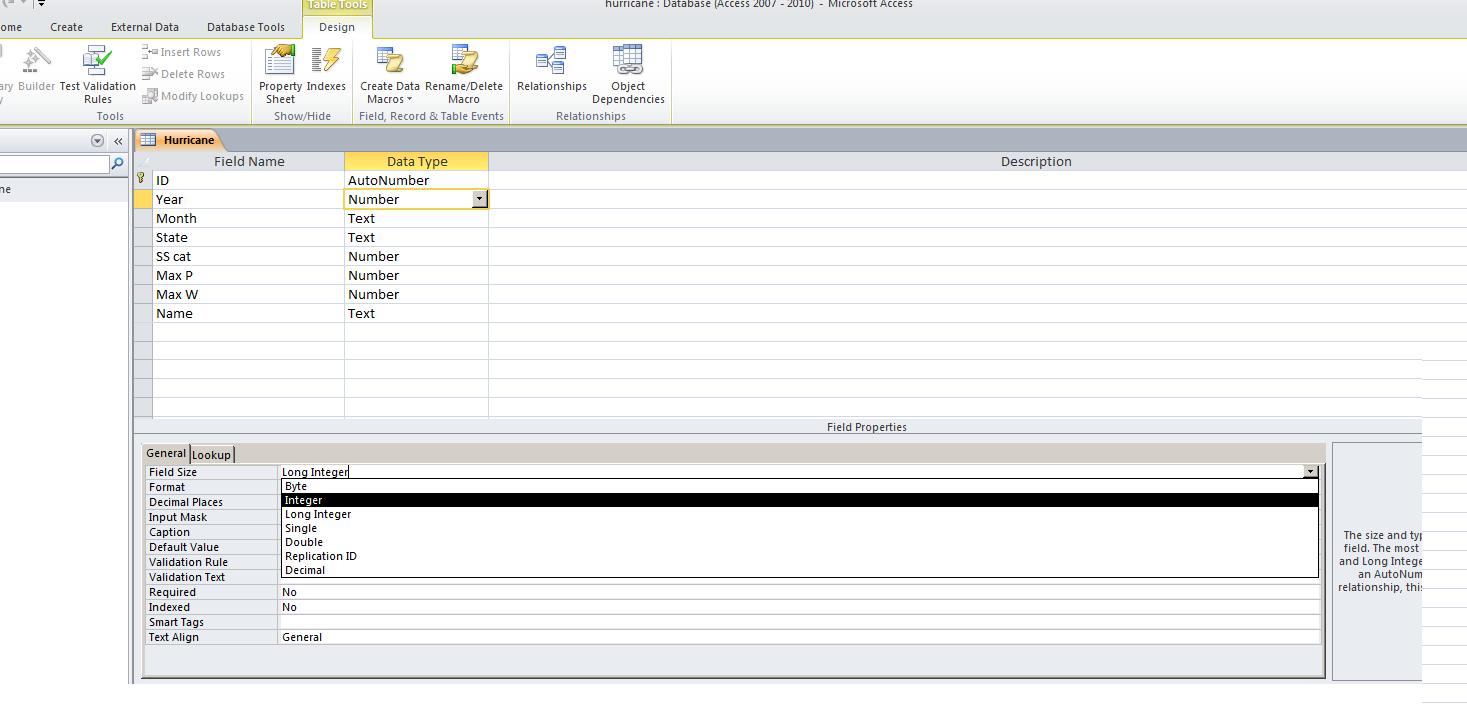
This screen shows the lower content when dealing with numerics. Computer architecture governs field size and one has to determine the highest and lowest value one will encounter. Byte handles the values of 0 through 255 and only integer. Integer handles -32K through 32K with no decimal places. Long integer is -1 billion through 1 billion with no decimal places. Single use 4 bytes to provide for 7 significant digits with a floating decimal place and scientific notation. Double uses 8 bytes with a floating decimal place and scientific notation.
We should also add some content per the required option. If indicated as yes, you must enter something in the field before Access will allow you to move to the next record.
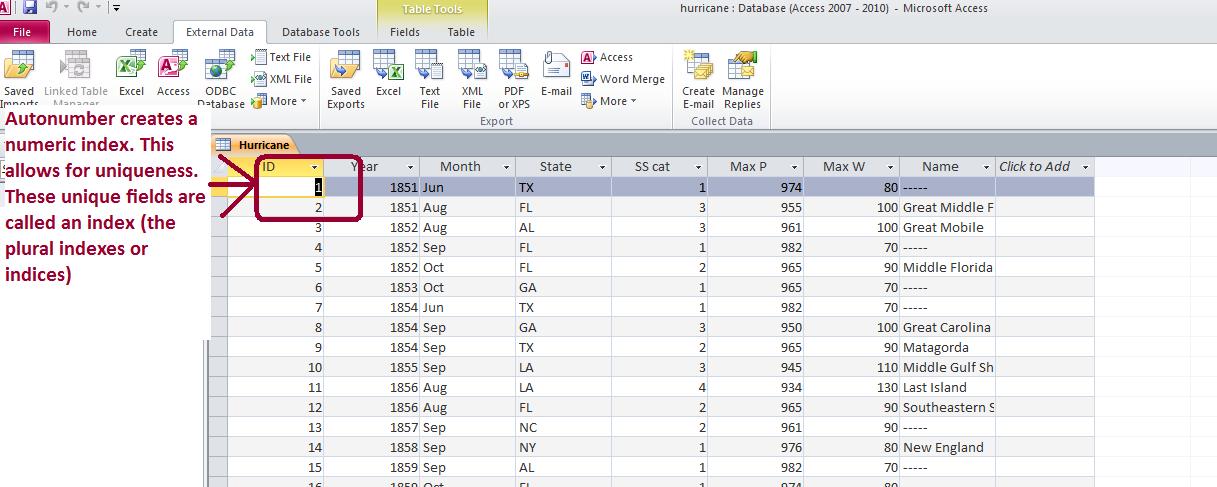
In converting from text to the table, we allowed this table to be indexed by an autonumber. This is the first column. Using integers we can have up to 2 buillion records processed through this table. Keep in mind that any number can only be used once. Therefore, you may not have 2 billion records at any one time since deletions count.
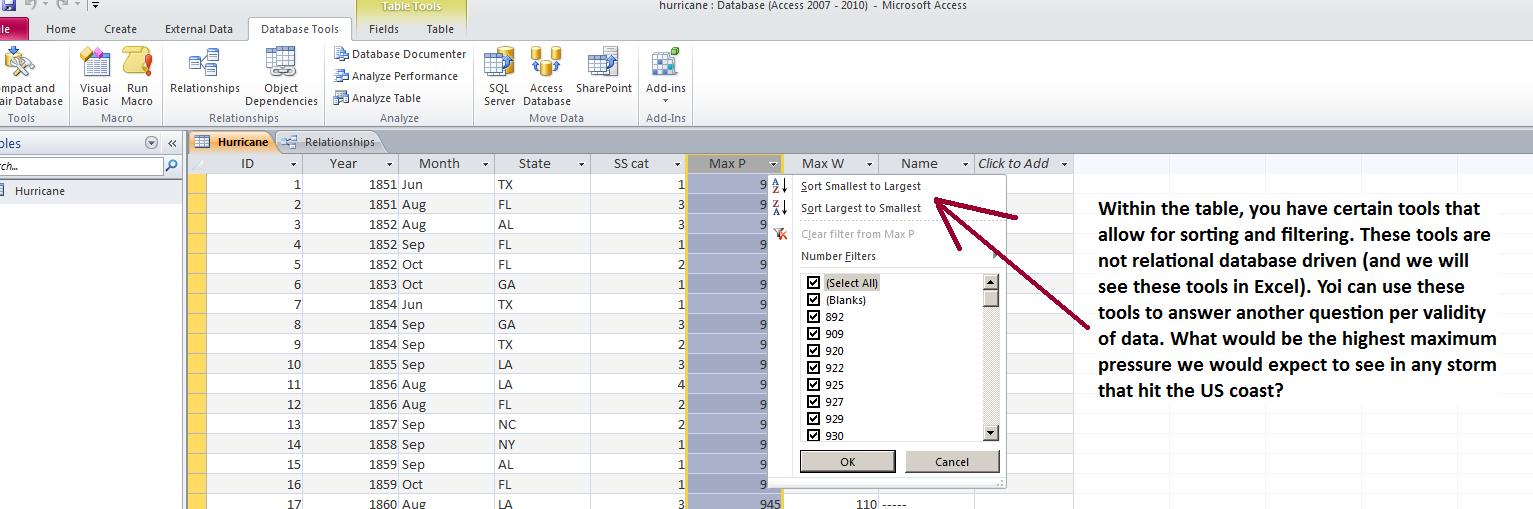
Let's return to datasheet view. Records are entered one at a time and are set premanently in what could call "entered order" Sorting occurs through something called indexes. Let's do an example of this looking at pressure. If we sort in either ascending order or descending order, we are not changing the entered order of the records. We are changing the order of display through an index. let's try some sorts. Bu the way, how would you get back to the entered order per display?
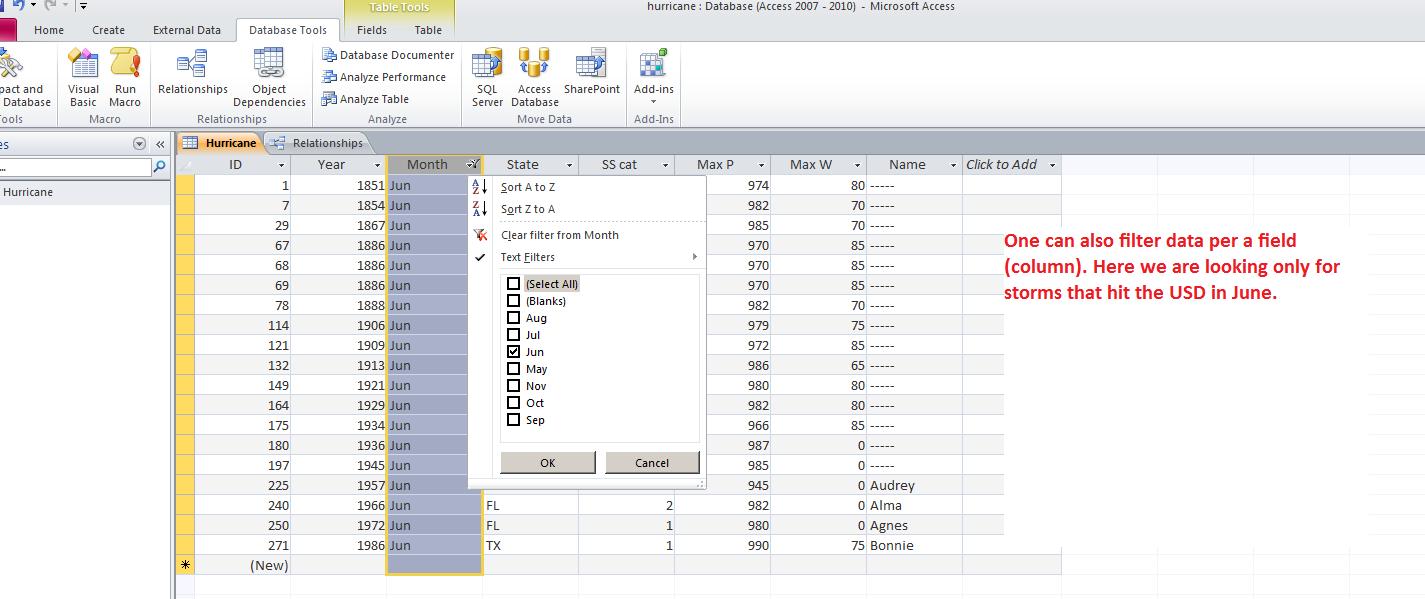
We can also filter. Filter is a term in data processing pertaining to the constriction of records shown. This is easiest shown by filtering on month. Notice how we can display the records of just one month or any specific months.
So far we have been looking a one table at a time. We have been dealing with Access as if it is a flat file database. Access can do much more. But to do this, we need to study queries. We will bring up a query using one of the tablew we already have dealt with and deal with one table. This should take us to the end of the class but next class we start to look at two (or more tables) in what is called joins.
Above, we moved data from a txt file to an Access table. It is easier to do this using an excel spreadsheet. click here to access an excel spreadsheet on German Uboat losses during WWII. The information on this is in sheet1. Create an access database with this info as an access table.
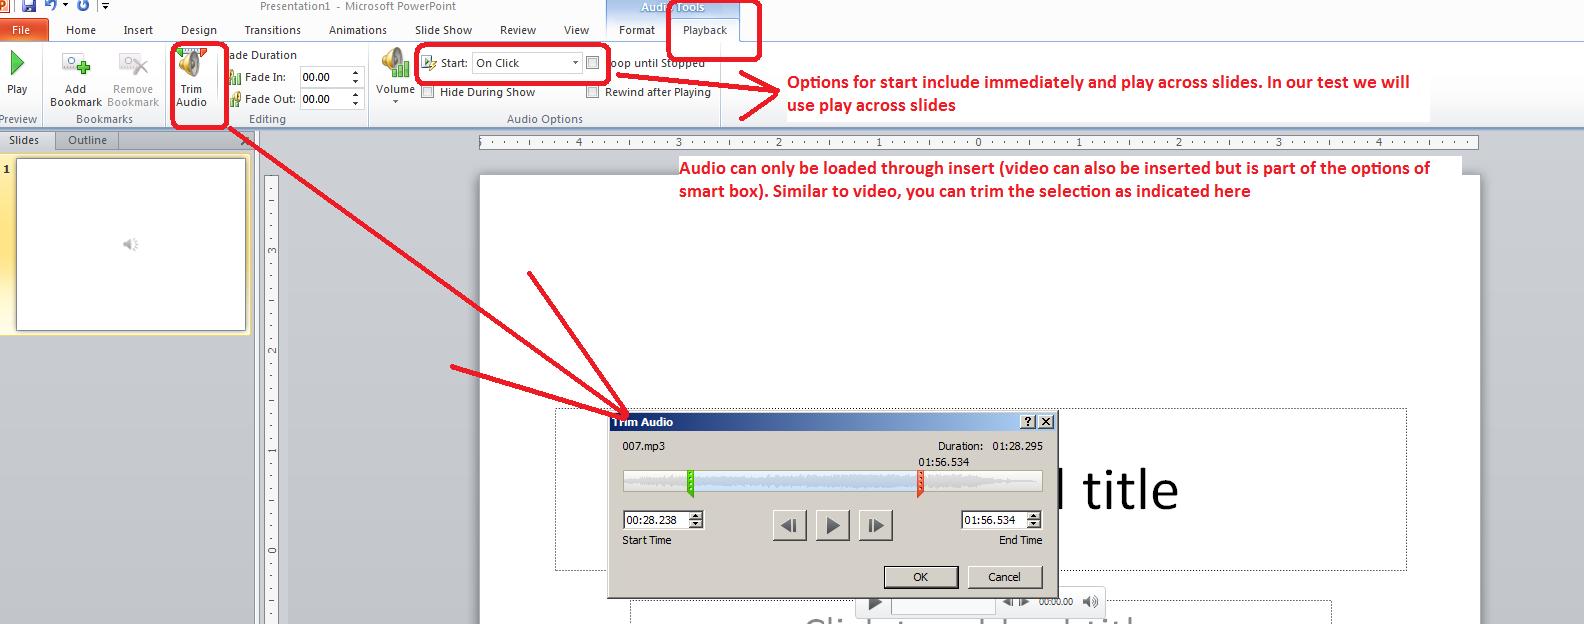
At the beginning of the class this week we want to look at loading music and videos (although we'll use audio for our example. You can access the music used in our test by by clicking here.. Below is an example of dealing with video.
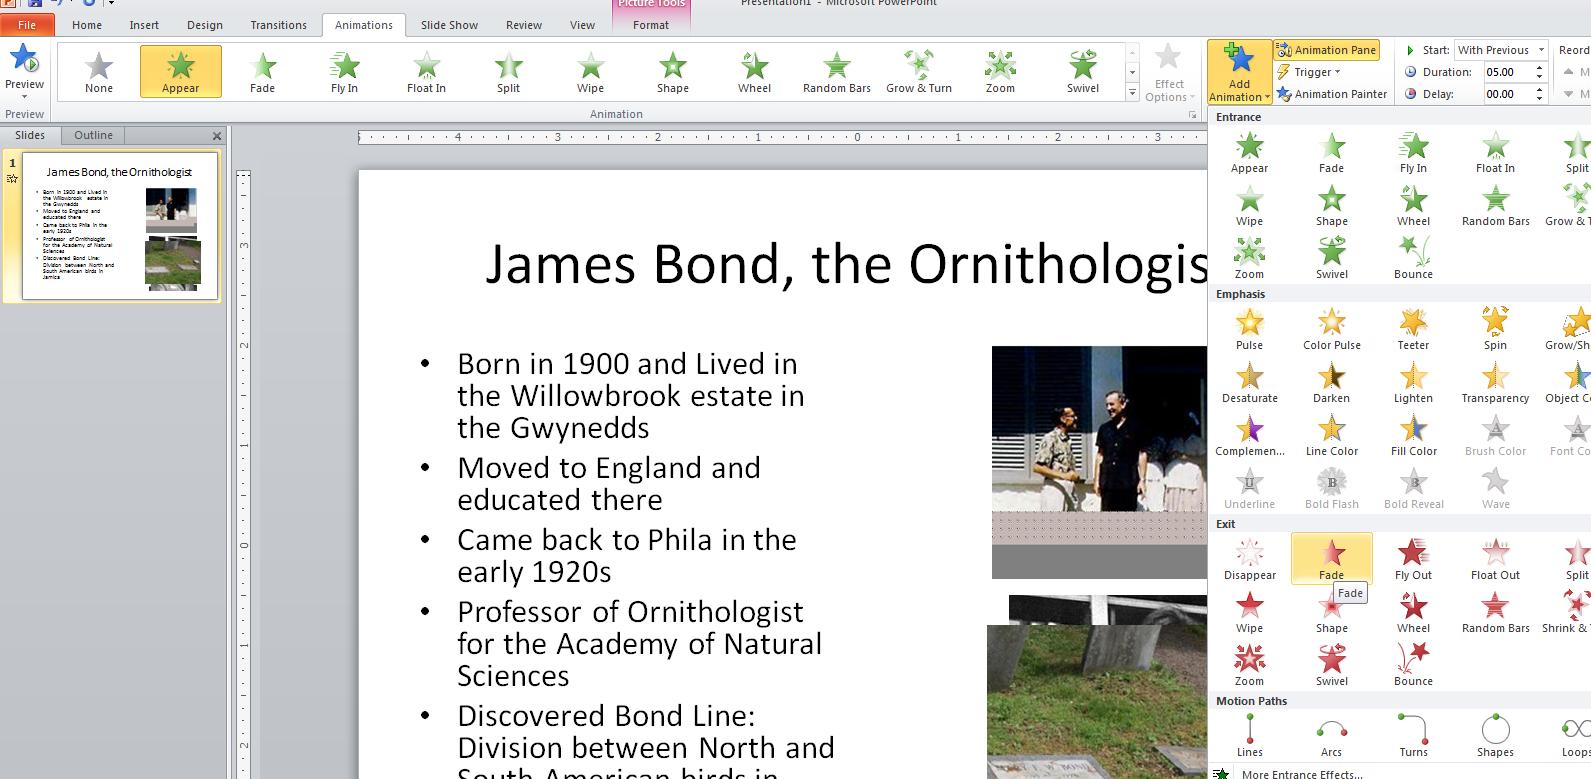
Next we want to look at animations. We did a little of this at the end of last week. For an example let's concentrate on the original James Bond, the ornithologist. Here's some pictures:


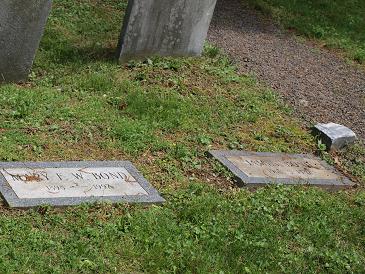
On the last two pictures we want one to fade out while the other fades in. The pictures below show this setup and the slide in action

Powerpoint has its origins in the middle '80s as users attempt to make better spreadsheet (in this case Lotus) presentations. A term starts to be used called presentation graphics. Apple is in the lead on this as far as operating system companies are concerned. Other third parties, such as Harvard graphics, also create interesting packages. When we open powerpoint we are looking to some degree at Word with no text, just Objects.
Powerpoint starts you out with a selection of templates as indicated below left. No doubt these will be useful in most cases but in the problem we will be doing these will not have much of an effect. In the middle is a super box that microsoft provides with the use of some of these templates. This superbox allows the user to insert bulleted text, tables, charts, clip art, movies and pictures. All of these objects can be inserted using the insert tab of the ribbon but this box makes it much easier. Finally, any object inserted can be animated. Animation gets you close to programming. You have the ability to create entrances and exits among other things. It's kind of fun and last term I concentrated on this with my classes. For our classes this term, it will be more chocolate and vanilla. Howver, below right, you can see an object and through the animation tab, the possibilities exist for entrance, exit and enhancement options
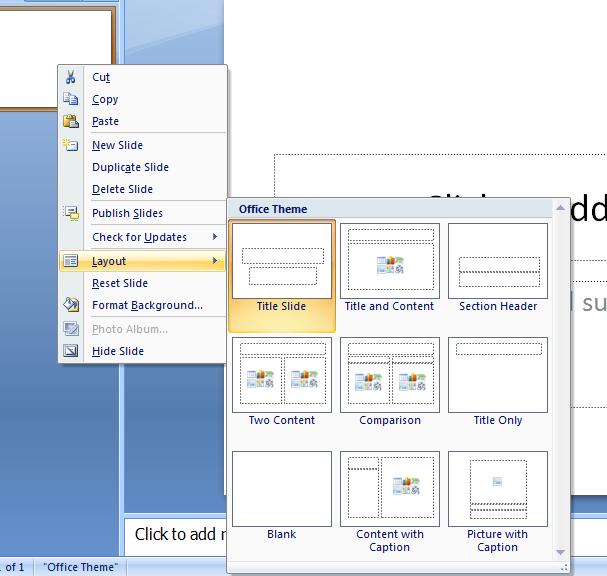
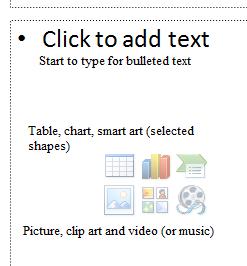
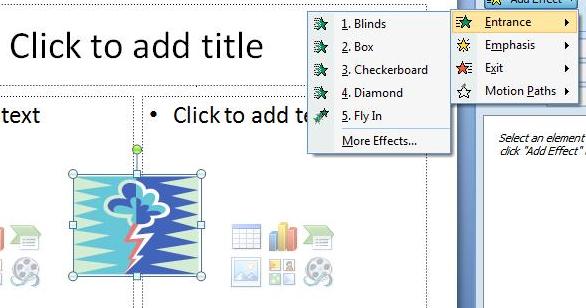
Let's open up powerpoint. Keep in mind, that this is to some degree Word without text. Text is very important, but it is part of objects. To the left is what is known as thumbnails which was pointed out in the lecture on Word but not used. It is situated where document map is located. As opposed to documents, Powerpoint works on slides and slides have one of 9 possible starting templates designated as layout which you can see by right clicking the thumbnail. One of these templates is blank. Below, is an example of this.
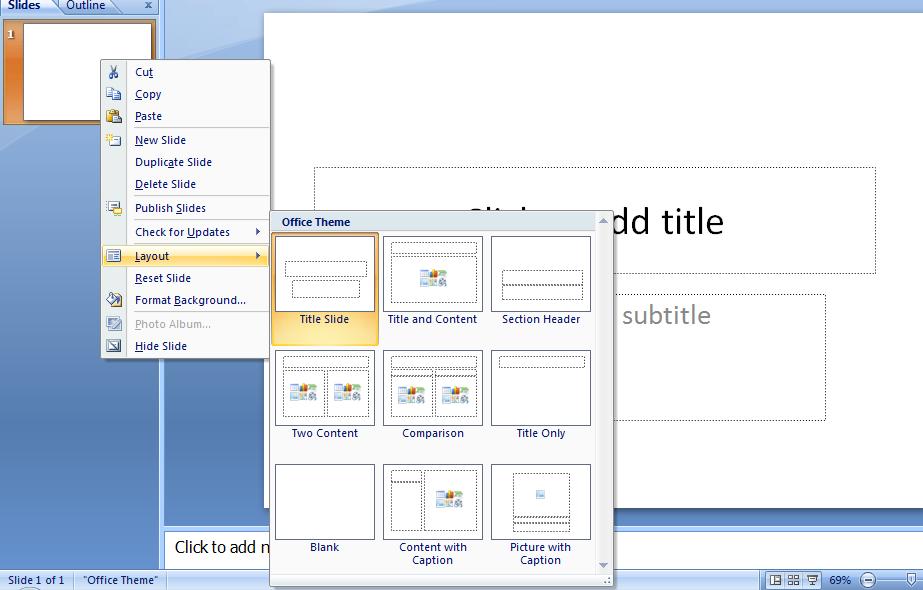
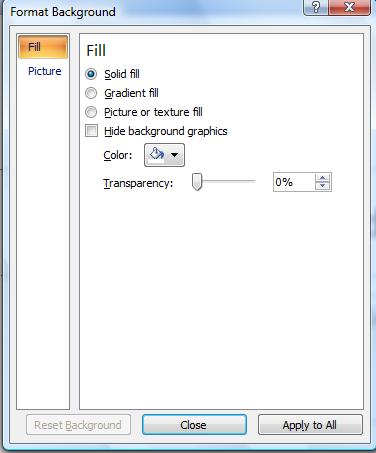 Notice these templates are made up of text boxes and what Microsoft calls smart boxes. We will return to these shortly. But first, how about the background. For this, click design. If we had the time, we could have done this in Word as the coding and principals are applied. You will see 20 themes (including the default white) and click on one, Even with the default layout, you should be able to see a difference. Now, each of these themes can be modified and the preview tools used in word can be used here. Click on font and see how the whole slide is affected. Similarly with colors where a set of colors are indicated. You can if you want affect the underlying style by using options of background styles in essence to make your own type of theme. If you really get good at this, find a piece of the background and click your right button and you'll get more options for this as to the left.
Now, let's return to the templates themselves. You are familiar with text boxes in Word and windows but these text boxes have a bit if smartness associated with them. We should be dealing with the default template. One of the text boxes should say Click for title. Move your cursor inside and start typing CIS103. Notice that a certain height and justification is assumed (the justification is centered) automatically. You can change the font size if you wish, but in my case I am seeing an assumed 48 points.
Right below is the text box indicating click for subheader. Move inside this and type Section 181. Again, defaults are at work as far as centering and font size.
Let's alter the template to the most advanced possibility - this would be comparision. Click this and you will see that our text has been incorporated into the new template. Now, you have some added text boxes and we can assume that defaults as far as justification and font size are established for them. We, however, are interested in what Microsoft designates as a smart box and you can two of these. The smart handles 7 different functions. You can insert tables, charts, smart art, pictures, clip art or media (audio and/or visual). Not surprisingly these options are available to you on the insert tab of the ribbon except that it is more convenient to do these insertions through here. Now, surprisingly, we will ignore all of these. You will notice a seventh option, click to add text which we are about to do.
Start typing the microsoft office components we are to study in this class - Word, excel, powerpoint and access. Notice that these become bulleted as you type them.
This smart box has become a text box. What is a text box. It is a separate area from the word processing buffer (assuming we were in Word) where you can deposite text. Before going further in the discussion of text boxes, let's spend some time dealing with bullets and numbers in Powerpoint. It is similar to Word with several exceptions as you are in a text box. There is a verticle alignment feature which we can test amd, even more surprisingly, a text direction component. We touched on this when talking about drop cap ion Word but you can now see this in play here.
Similar to what we looked at in Word as far as pictures, text boxes are movable which we will demonstrate and you can affect their size. Notice that aspect is not a problem since each piece of text is defined with a font size.
Text boxes in Word and powerpoint can be inserted but there is a difference in Word versus powerpoint. In word, you define the height of a text box. In Powerpoint, your entry into the textbox defines the height. You define the width. As you create the text box, a format tab becomes available on the ribbon and you can see that this is similar to several tools we already studied. Take a look at the preset shape styles and the ability to make the text look like word art. You can even change the shape which your instructor wil ltry to do. What you can see here is that you can make a text box into an annotation and the other things we studied in Word. In fact this is what word does.
Your instructor will kead you into the creation of a powerpoint slide as indicated below

To do this powerpoint presentation, we need several pictures which you can find below:


Included in this is also some smart art, which is the cycle of arrows, and another arrow as a shape.
In class on Tuesday I showed the Arden powerpoint presentation. Let's do two slides from this presentation. They are:
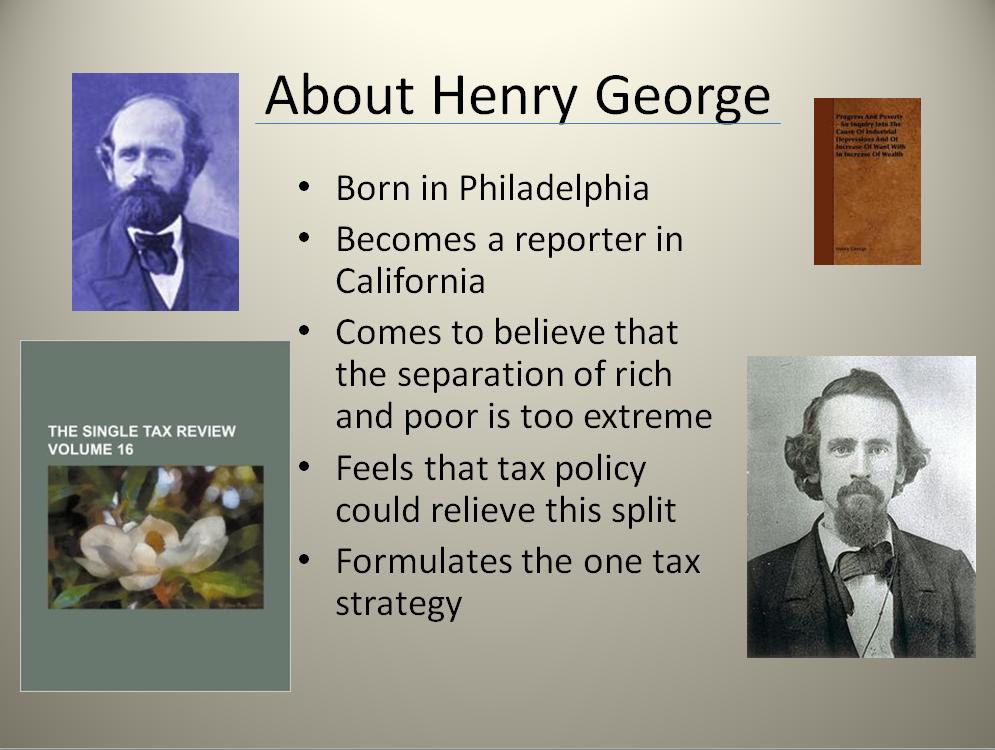

These are made up of bulleted points in text boxes, label and pictures. The pictures follow:

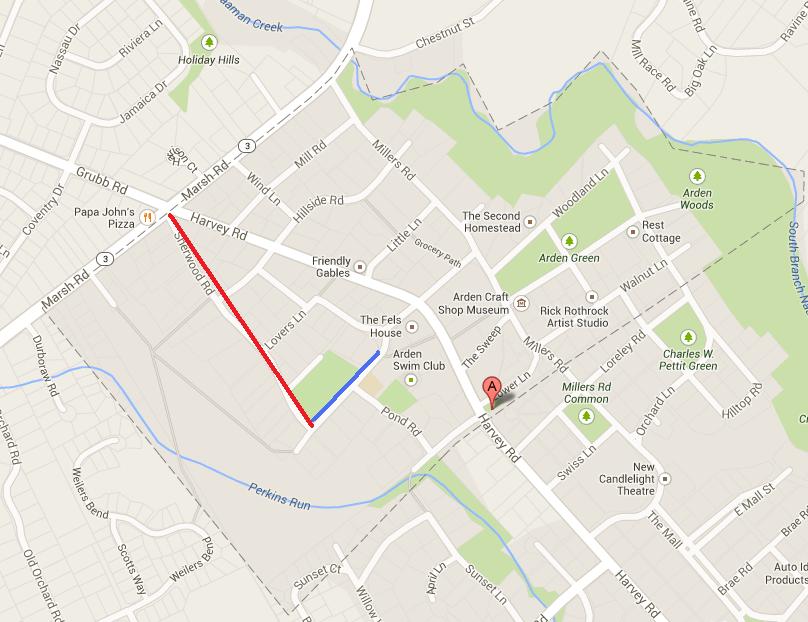
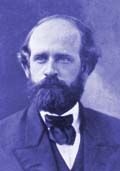
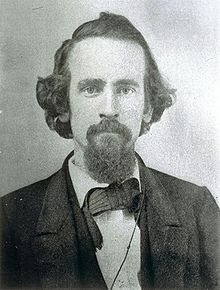


All right: Let's try another. This is more consistent with previous class content.
Now, let's deal with the second smart box and insert a picture. I know you will be shocked, but your instructor has been studying the life of a former very prominent Philadelphia area resident who wrote the famed book, Birds of the West Indies, in 1936, later reissued in 1948, 1960 and 1999 whose name is James Bond. Surely you also have read these books pertaining to ornithology. He was a very famous ornithologist and worked for the Academy of natural sciences. Of course, it's possible that you may have run across the name 'James Bond' in another capacity and, while your instructor doesn't think that this really is true, there are some that believe that an author used this name, given that the author was a birder and was familiar with these books, when he went on to write a set of books involving a character who dealt with espionage. You can access the Philadelphia, James Bond's, picture with that certain author, Ian Fleming, whom your instructor also studies by clicking here
Your instructor will kead you into the creation of a powerpoint slide as indicated below
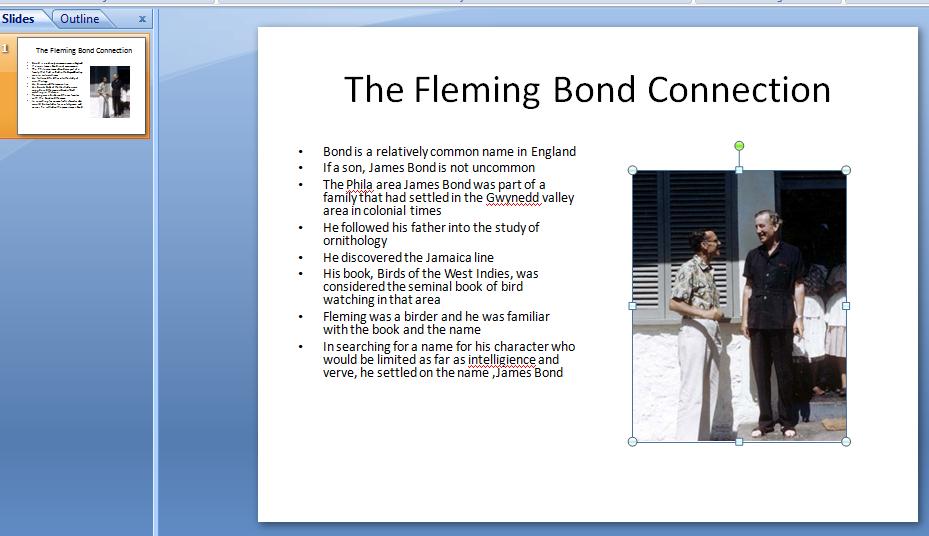
For our powerpoint test, we will use the following with changes. Here they are!
Let's use the following music which you can access by clicking here.
And heres the timings as indicated in the picture below
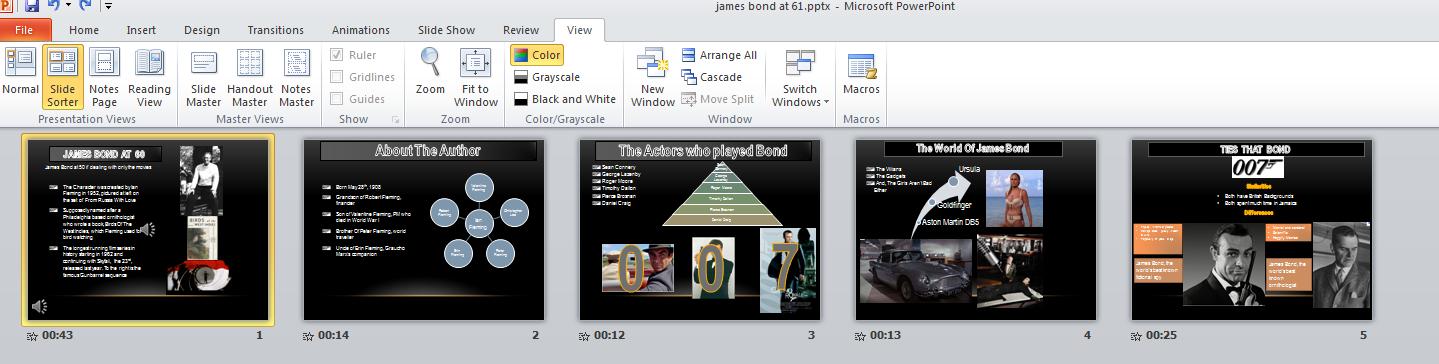
For our final we want to crate a five(5) slide powerpoint presentation. Below is the 5 slides

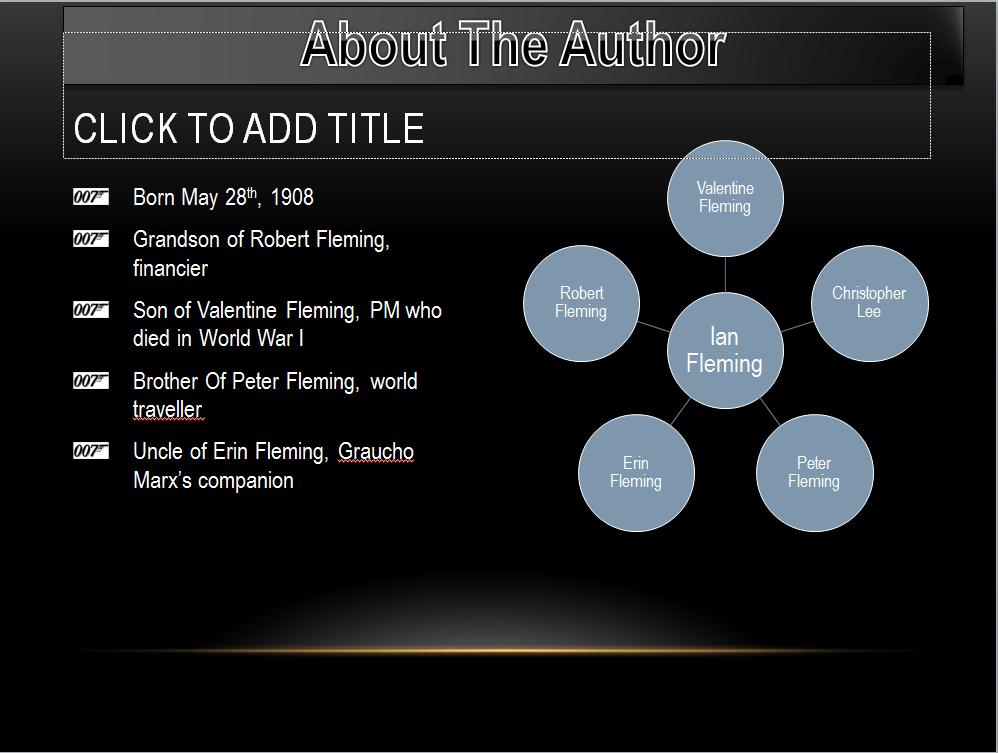

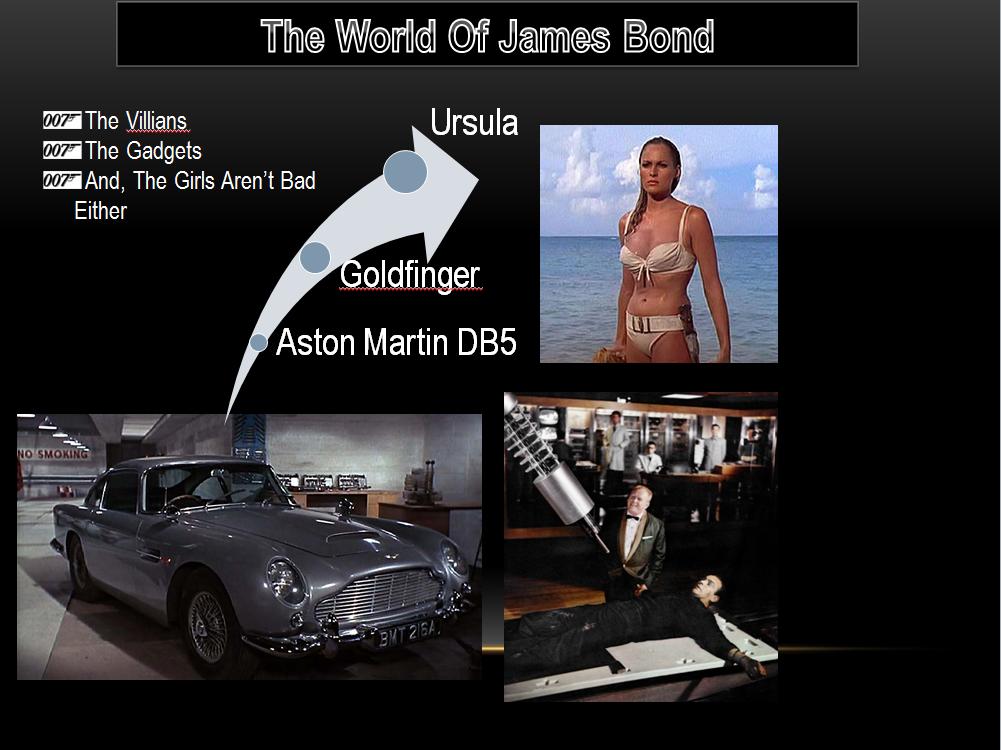
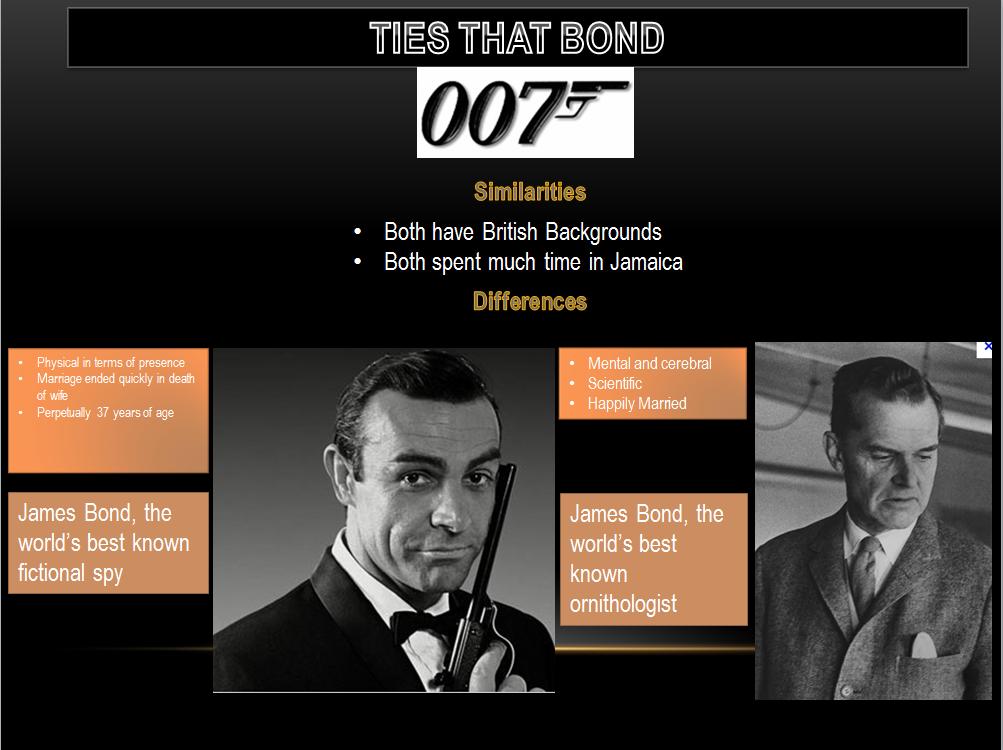
The following are the files needed to create this. These are not exactly the pictures used in our examples but they will work.
007logo,gifWe should try to put some music into this. How about the James Bond Theme? click here to load this music.
Once we have created this, we want to deal with movement of slides and animation. We are going to try to get the gunbarrel scene to act like the movies.
Click on transitions and you will see that on mouse click is checked. With this, you need to do something when a slide is appearing top move to the next slide. A mouse click or a hitting the key board will do this. Let's try this. Click from beginning on slide show as we show below.
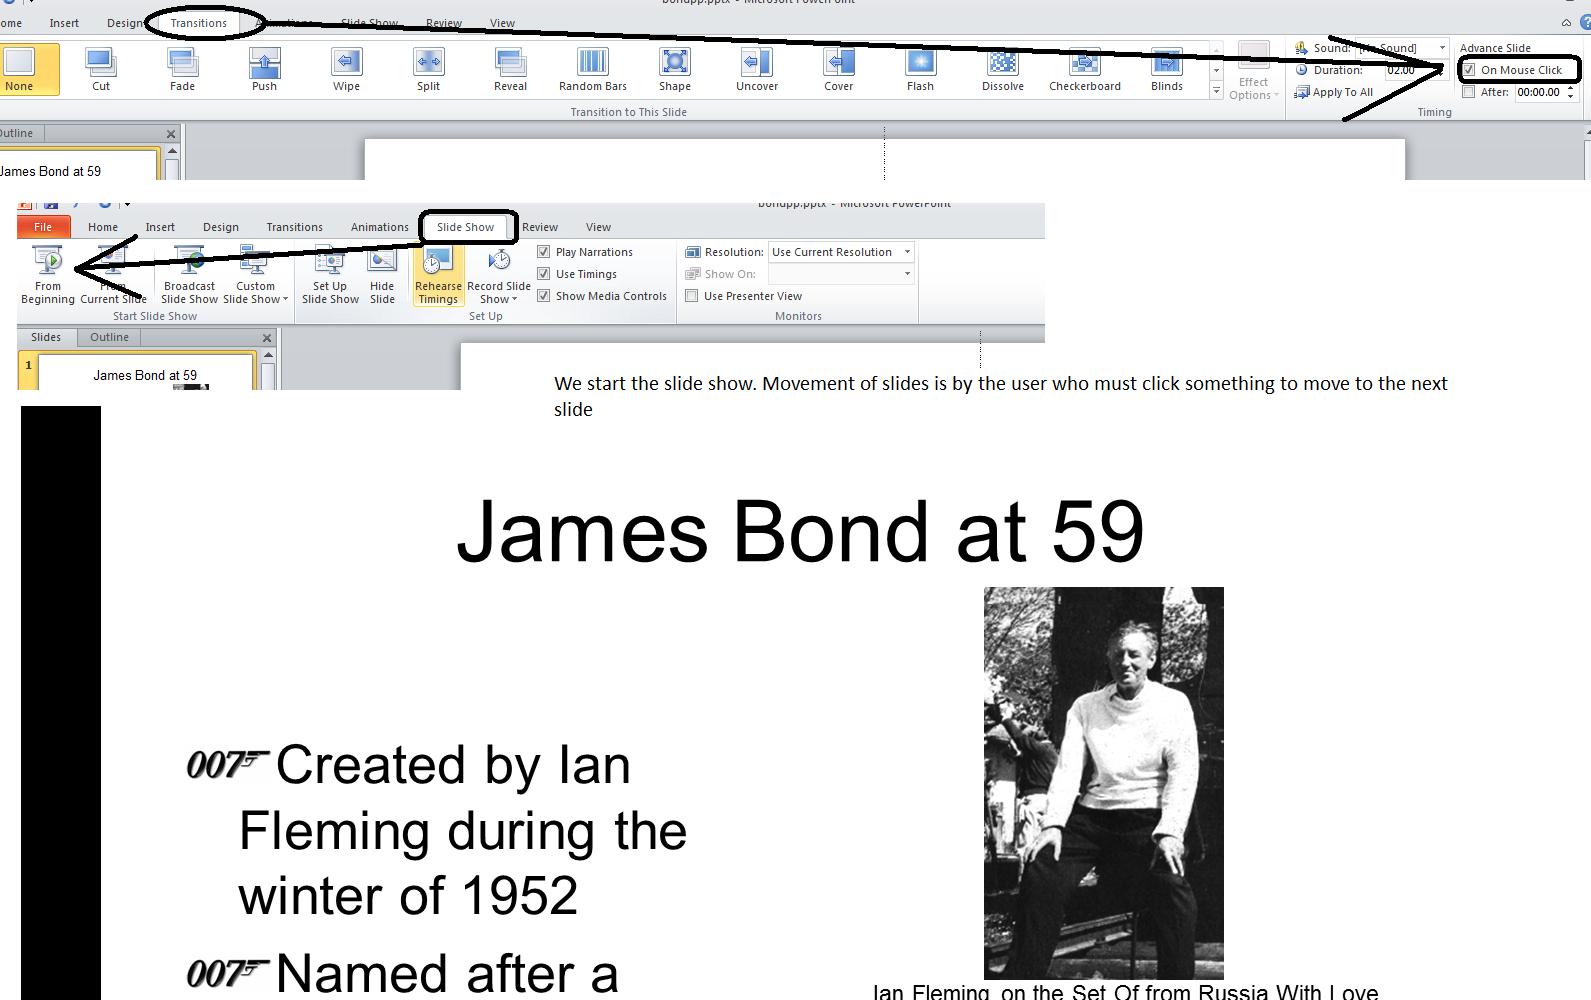
Let's assume that we want to have a transition as we move into the next slide. The transition tab handles this for us. Notice that transition is set to none. Click cut and then preview. Did you see a slight difference in the slide as it started up. Try wipe. you will notice that there is a specific transition. Click effect options and you can control from what location the wipe starts. There are many others that you can see broken down into subtle, exciting and dynamic. We'll try a few in class. But, wipe, has specific meaning to the content of this powerpoint slide show. Peter Hunt was the film editor of early James Bond movies and he was advised, if not urged, to spped up the move,ent of these films by Terrence Young, one of the early Bond film directors. Hunt's solution was what you are seeing as wipe. Movements in these movies were not done by traditional hollywood means but by this new technique that Hunt helped create.
Now, what if we want to time this show. On all except the last slide perhaps 5 seconds are needed to take in the slide. For the last slide, perhaps 10 seconds. Now, put in 00:05 (or click the spin control 5 times. Don't forget to unclick the on mouse click (although you can use this to transition faster, if needed). Now apply to all and you will see that all the slides are at 5 seconds. We can run this but we will notice that the last slide does not allow enough time to read. Set that slide to 10 seconds duration.
 Now we will also need a picture of catwoman and this should work
And we need another Word document which you can access by clicking here.
We start our discussion of Microsoft Word. First things, first. What controls on the tabs of the ribbons are we going to deal with? We neew some definitions for word processing as, for instance, what are msrgins and the topography of a paragraph. And, what is a character, word, paragraph, page and document. Once done with this, let's attack our first problem which in class will be different than your book!
In this class you will see material in two ways: one through me, the other through your book. Is your book important? One assumes that the tests on the web site will use the material of the book. Is my stuff important. We hope it gives you a better understanding of the use of this software.
The first chapter of the Word section in the book does the Aspen Falls Public Library problem. You should be doing the Aspen problem on www.myitlab.com. I believe I have loaded the necessary material from my side of this onto the course and let me know if this is not the case and we'll add more. At the end of the chapter are additional problems you might want to try and above I have provided access to the files needed for this although you can can find the files on the Q drive - a drive shared throughout the school - under Computer technologies and then cis103 student files. It is important to be keeping up with the book since your tests on the MYITLAB website involve the book contents.
As stated previously, We are going to do a different problem in class that is slightly harder and moves into the next chapters of the book in terms of tables, quick parts and objects for insertion. We could have used the Seuss file to do some of this, but this is a more complete problem.
I call this the catacomb(s) problem. Below is a part of what we are aiming at.
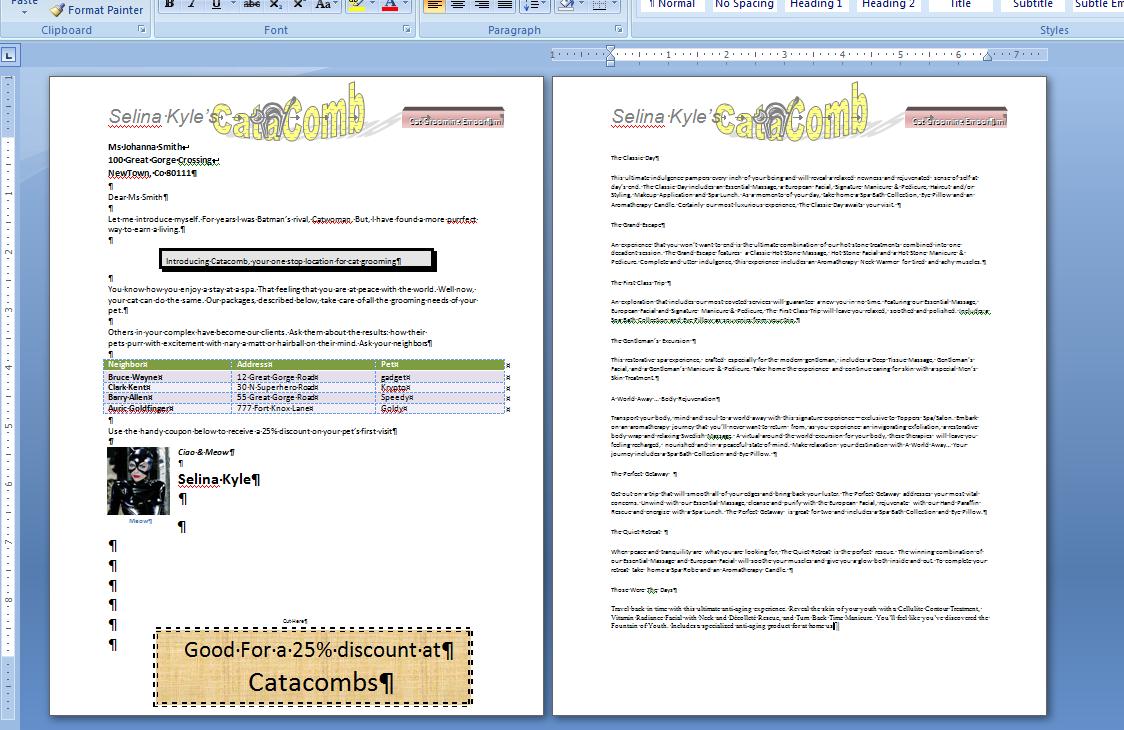
We do need some more definitions before we start a word processing problem. In the previous week we looked at the technology of the ribbon so you should be comfortable with that. You should understand character, word, sentence and paragraph. Thgis problem will hopefully give you more practice with character commands, not to mentioon paragraph commands. In the end, we should also see a use of styles. But, just to put you on a par with other users of Word, here are other things to consider:
We do word processing on a sheet of paper. Standard paper in the US is 8.5 inch by 11 inch. A second standard, designated as legal, is 8,5 by 14 inches. Years ago printers were designed to handle both standard although today you might purchase a printer that does not handle the legal standard.
Paper sizes are not uniform around the world and Word is designed to be able to handle these other standards although your printer may no be in that position).
When creating a word document, you already are aware that you skip space at the sides of the paper and this is called a margin designated as top, bottom, left and right. Top and bottom contain their own sections of code designated as header and footer.
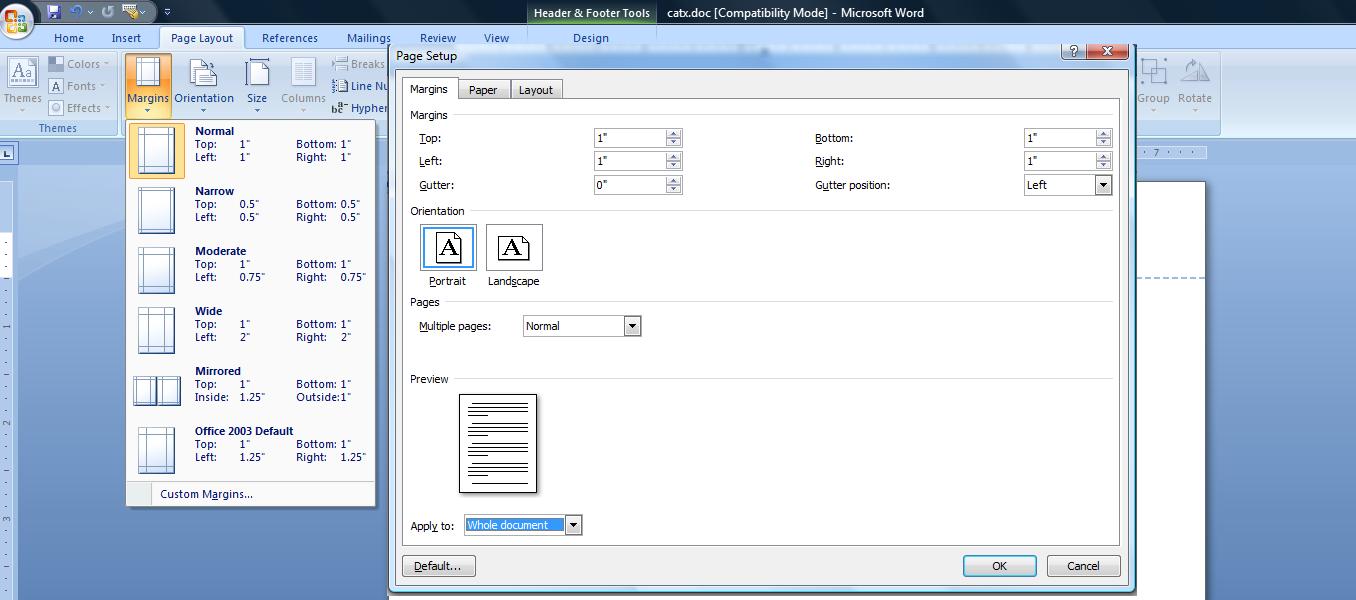
Now, when entering data into the word, a single hit of the keyboard enters a character. A set of characters delimited by spaces, a beginning of a paragrah marker (to be defined) or end of paragraph (again t be defined) is a word. Word do not need to have meaning. 123 or abc are words when typed. To determine meaning and achieve corrections in spelling, Word provides tools such as the spell checker and autocorrect to accomplish this.
A group of words ending in punctuation is a sentence. Similarly, if a sentence should need more room than what is available left to right on the screen, the coding automatically moves to a next line as you are typing. This creates two definitions: word wrap and line. Word wrap (or a soft return) is where you are typing a word and it encroaces the right margin and the system forces you down below and to the right to begin a new line and line is the physical result.
The definitions above more or less meet language requirements. The next doesn't. A paragraph in Word processing is the hitting of the enter key. This creates, in essence, a user defined word wrap as the system takes you done and to the left. This is also known as a hard return. This definition of paragraph has great effect in Word as commands are, for the most part, broken down between character and paragraph. A character command requires text to be selected to invoke immediate results. If no text is selected, placeholders are inserted into the text at the point where the character command is initialed and these are invisible to you at that point. Later, if coding is encountered at the placeholders, the cosing is entered with these attributes. Paragraph commands require only that one or more charaters of a paragraph are selected (and in most cases you can get away with the cursor being positioned on the paragraph) to effect changes to the whole paragraph.
Word has a tool, as you are already aware, for determining where enters have been hit as well as spaces and this is hide show. Below is a graphic indicating this usage and we will use this tool as we do this problem.
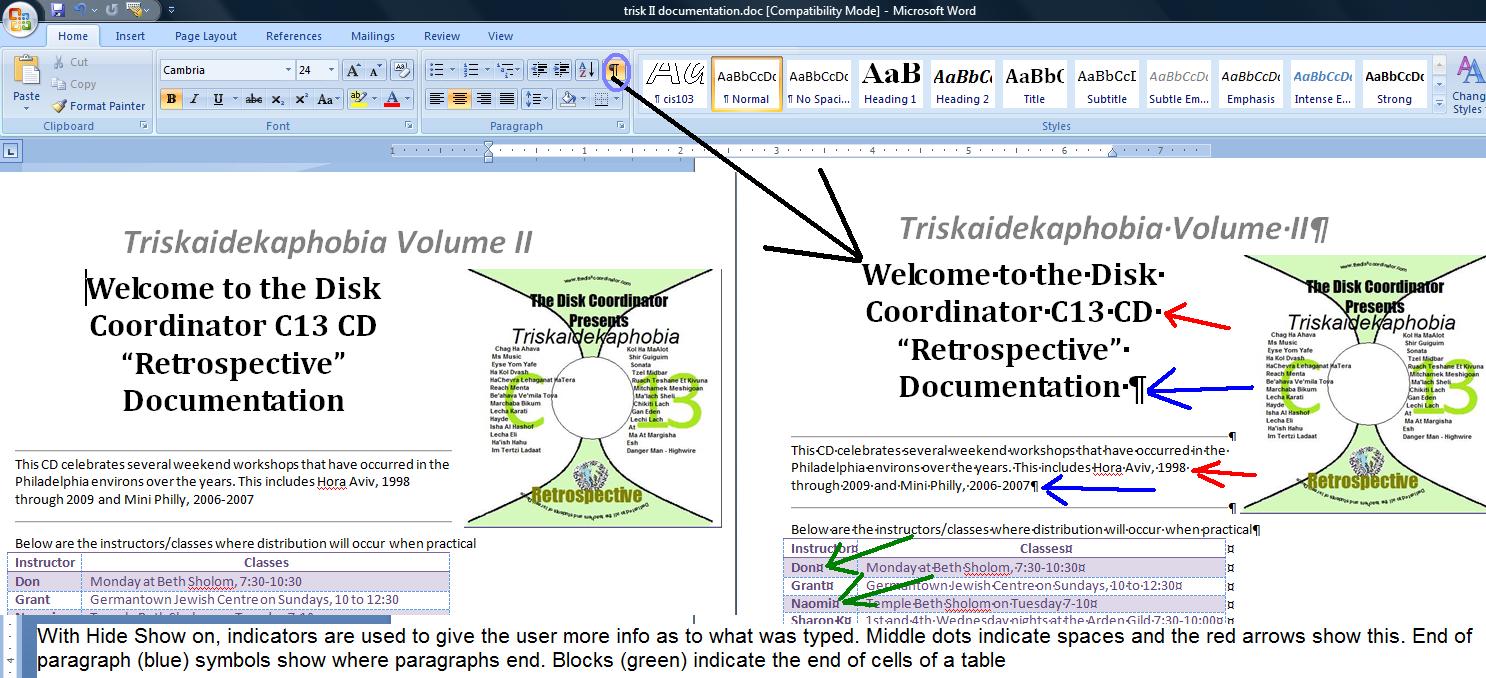
In word processing several characters that are contiguous (together) separated by spaces or punctuation (or the beginning of a document or the end of a document or the beginning of a paragraph or end of a paragraph) is designated as a word. Any word can be selected by a double click on it. FYI: In XP and in Word 2003, there was something called a smart mouse which would automatically highlight the entire word one one of the characters was selected.
A group of words together before and after paragraph breaks (or beginning and end of doucument) is a paragraph. A paragraph break is nothing more than the hitting of the enter key. THius can be selected by a triple click and tyou can see the action as first the word is selected and then the paragraph.
Let's start with a new document. If in Word already, use file/new and select a blank template. If bringing up word without selecting an existing document, Word should put you into a new document.
Notice the title bar up top. The name should indicate Document1 - Microsoft Word. Word defaults to specific names for new possible documents. Documentx where x startts at 1 and increases for every new document added during a launch (launch is a Microsoft expression to designate that a version of word is up and running). You should be in document 1 at this time. You should not save the file with this name and even with the name doc1.docx that the system will substitute when you are in save as.
We have been in Word before. With a blank page, let's determine what Word sets as parameters. First, you should see a blinking indicator at 1 inch down and 1 inch across. This is the I cursor. The I cursor is where you enter text (and objects). Another cursor you should be aware of is the mouse cursor which is free to roam. If we take the serial and parallel discussions from previous classes, the I cursor os serial,the mouse cursor is direct. If I get the chance, I will show you a great new feature that has been added to the interaction of the I and mouse cursor but onward to other things.
2 new definitions. Where your mouse is atv the moment is the home postion of the document. You can always get to the home position by clicking Ctrl Home. As you enter data into the document, the end position of the document moves further down (at the moment with nothing in here, the end position is the same as the home position). You can always get to the end position by the cus of ctrl end.
What about the way this document will appear on the paper. It will not move from the top left of the paper to the bottom right. It is constrained by margins. Because of the nature if printers there is a natural margin of probably about a quarter of an inch. We obviously want to use more than this. Until 2001, Microsoft used the standard of 1" around. In 2001, they changed to 1.25" left and right and 1" top and bottom now known as the Word 2003 standard. For this version, they are back to 1" around. The top and bottom margins are special as they can contain additional information. Margins can be set through the page layout tab and can be changed at any time which means that the program will automatically realign the document as the margin is changed. Below, we show a composite picture dealing with margins.
Not that it means much, but you can also change the size of your paper in page layout under size. In the US there are two standards: 8.5 by 11 and 8.5 by 14. In other countries, however, there are other standards generally smaller than that of the US.
While in this section, we should also indicate that you can change the way the printer prints per orientation. Word (and Microsoft office) supports 2 way: portrait and landscape. Landscape makes you document look as it it has been shifted 90 degrees as it prints.
Let's start with an address block. We will show this to you two ways. One is by traditional paragraphs, the other using breaks. let's start with traditional paragraph ad put your hide/show on.
First paragraph is Mr. Bruce Wayne, second is 1000 Wayne Industry Drive, the third is Bat Cave, NC 28710. Your document should look like:
Mr. Bruce Wayne
1000 Wayne Industry Drive
Bat Cave, NC 28710
and you would see the end of paragraph markers at the end of each line.
Let's use this to discuss spacing and the differences between non paragraph returns and straight paragraphs. The picture below is something we will talk about
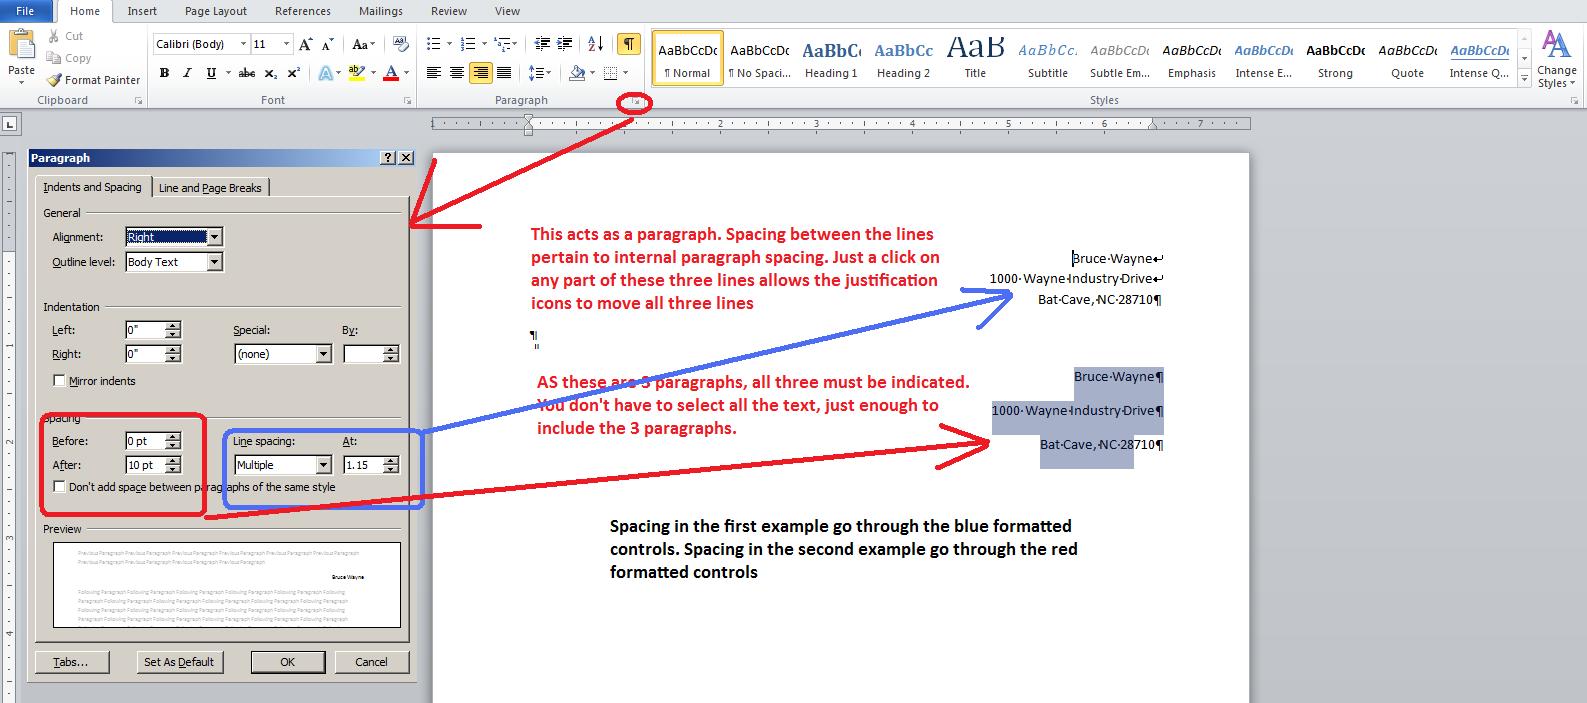
While we have a bit of a document here, let's look at some special commands. Ctrl A highlihts all the text which you can try in class as I am doing it. Ctrl Home takes you to the home position of the document and Ctrl end takes you to the bottom of the document. We have used enter and shift enter. What does Ctrl enter do. It creates a new page. By the way, this is called a hard page. Where the system breaks, the terminology is soft break.
We have more thing to discuss per paragraph spacing but in an oblique manner. To discuss this lets look at preview. We will first concentrate on points as indicated in the picture below.
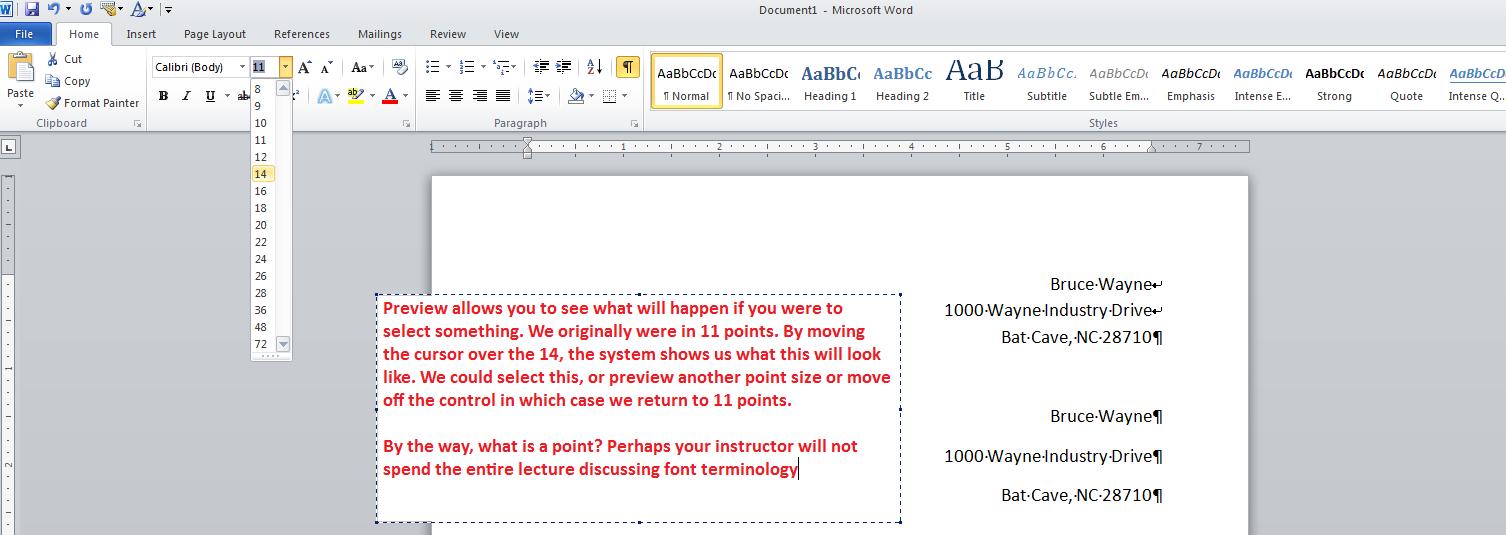
Let's do preview looking at font. Theoretically, the type setting industry reverses how we use terminology but for office applications the font will be fine. Below, and we will do this in class, we look at the circuitous route to the spacing of 1.15.
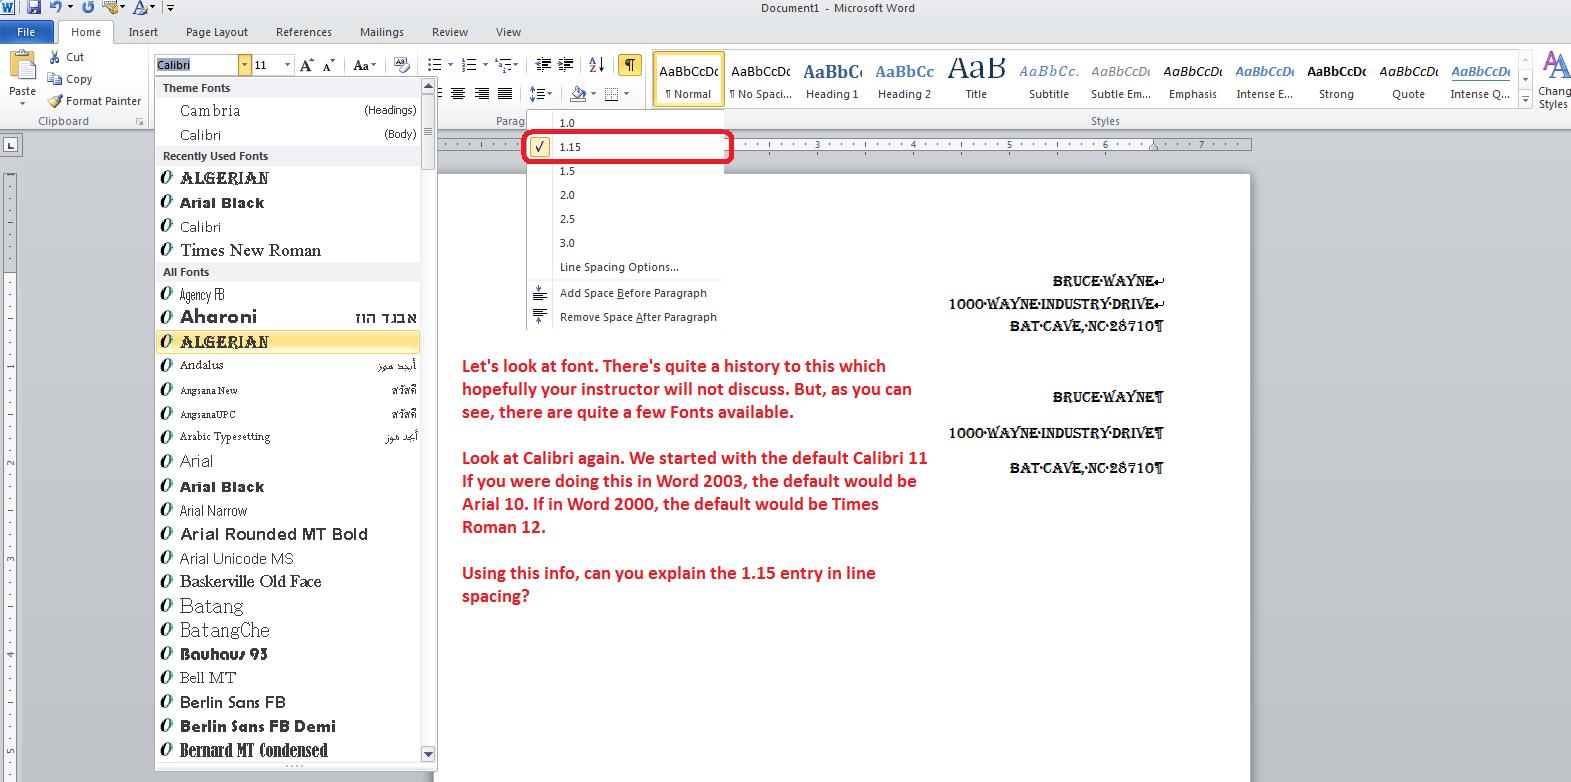
With this text and preview, let's look at many of the character commands of the font group. This will be grow and shrink, casing, bold, italics, underline, coloring and, if we can, text effects which is a version of word art.
We are going to change things from what you see on the catacomb printout. Let's insert a date at the home position of the document. How is date determined in Word - quite frankly by your system?
Below you will see a previous year's way of doing this. For today, Sept 24, 2013, look at the following screens.
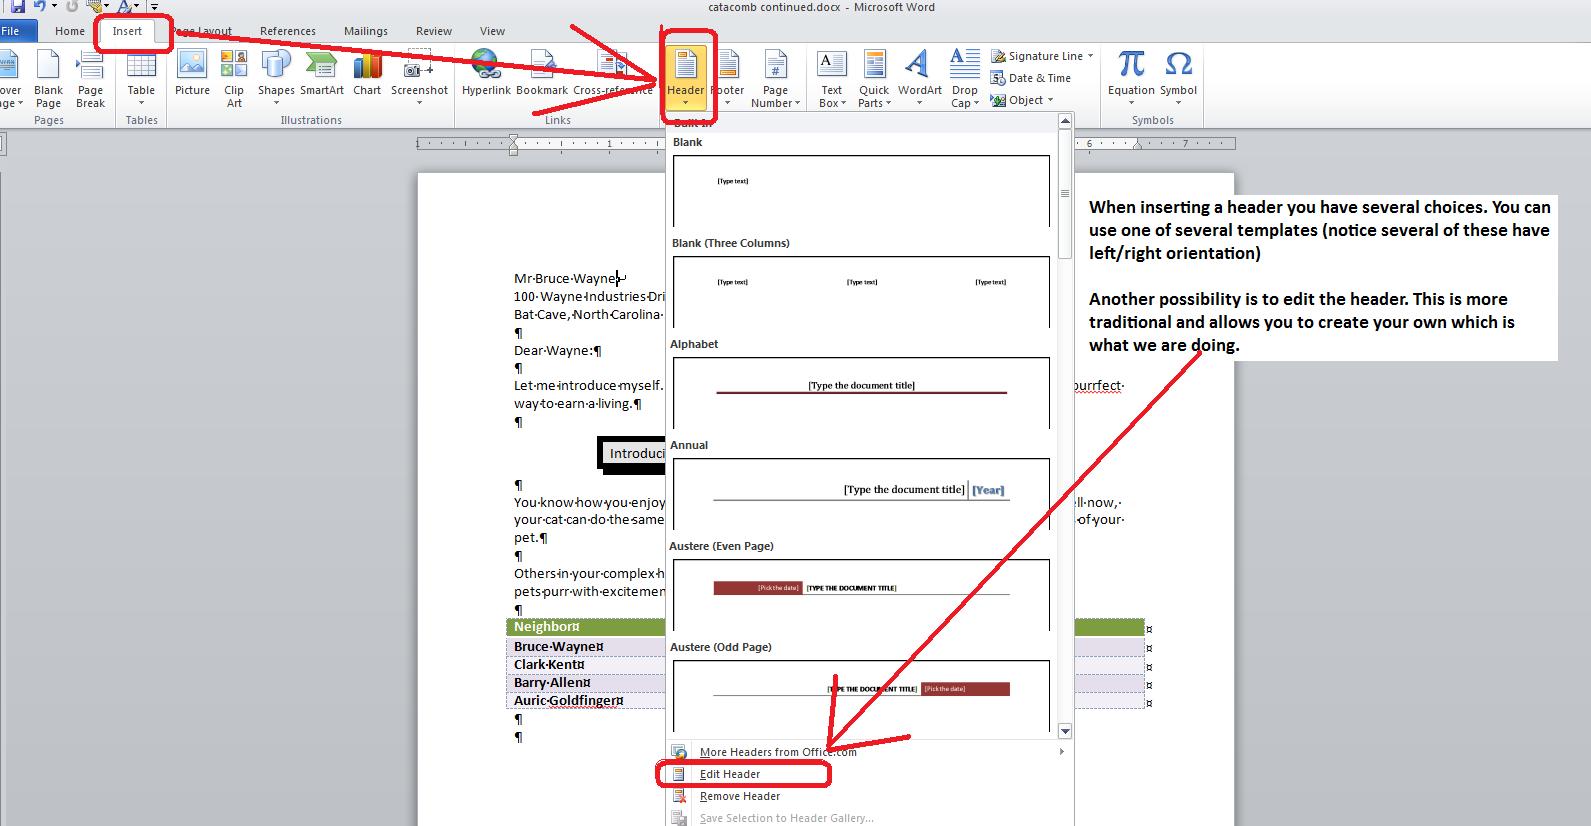
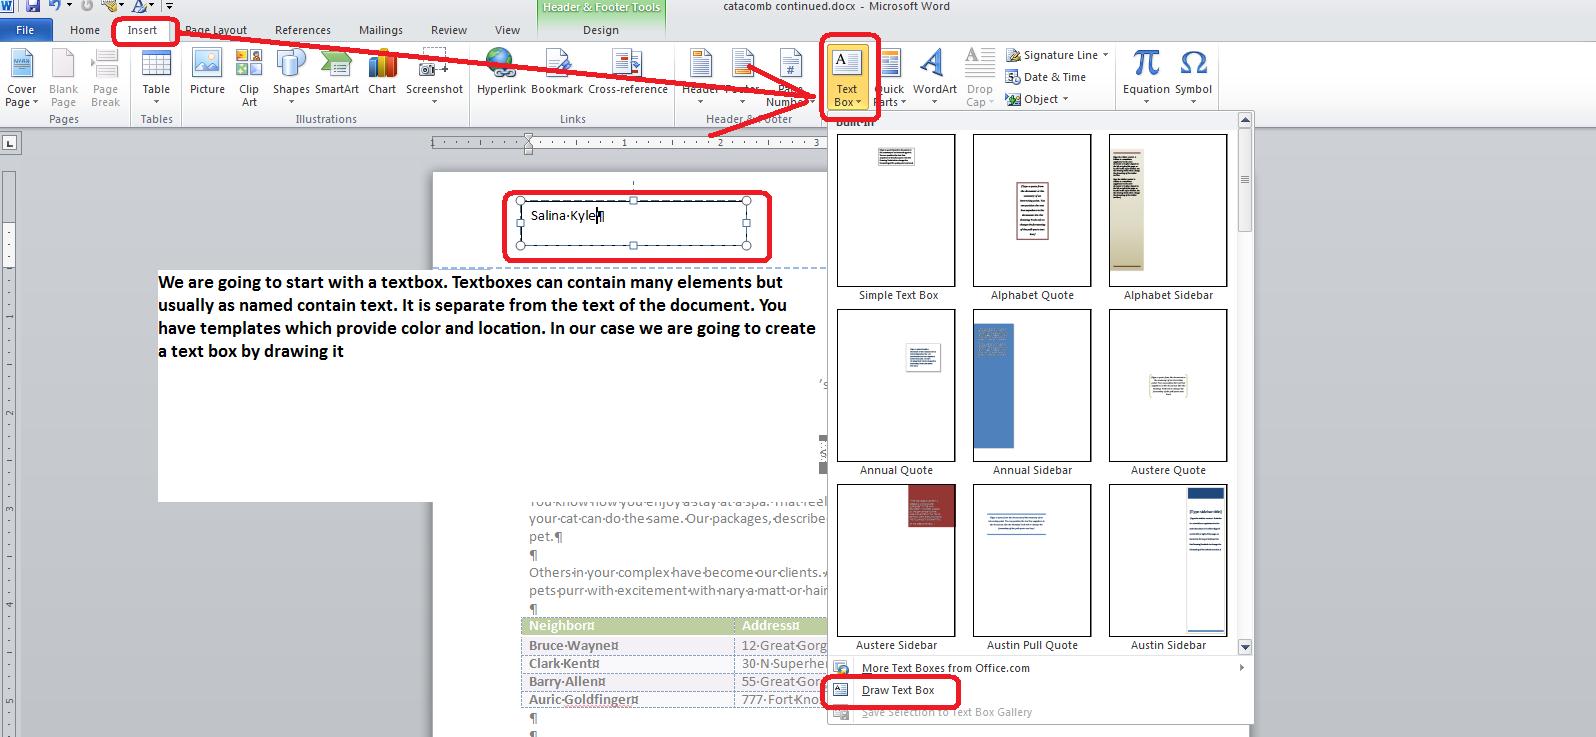
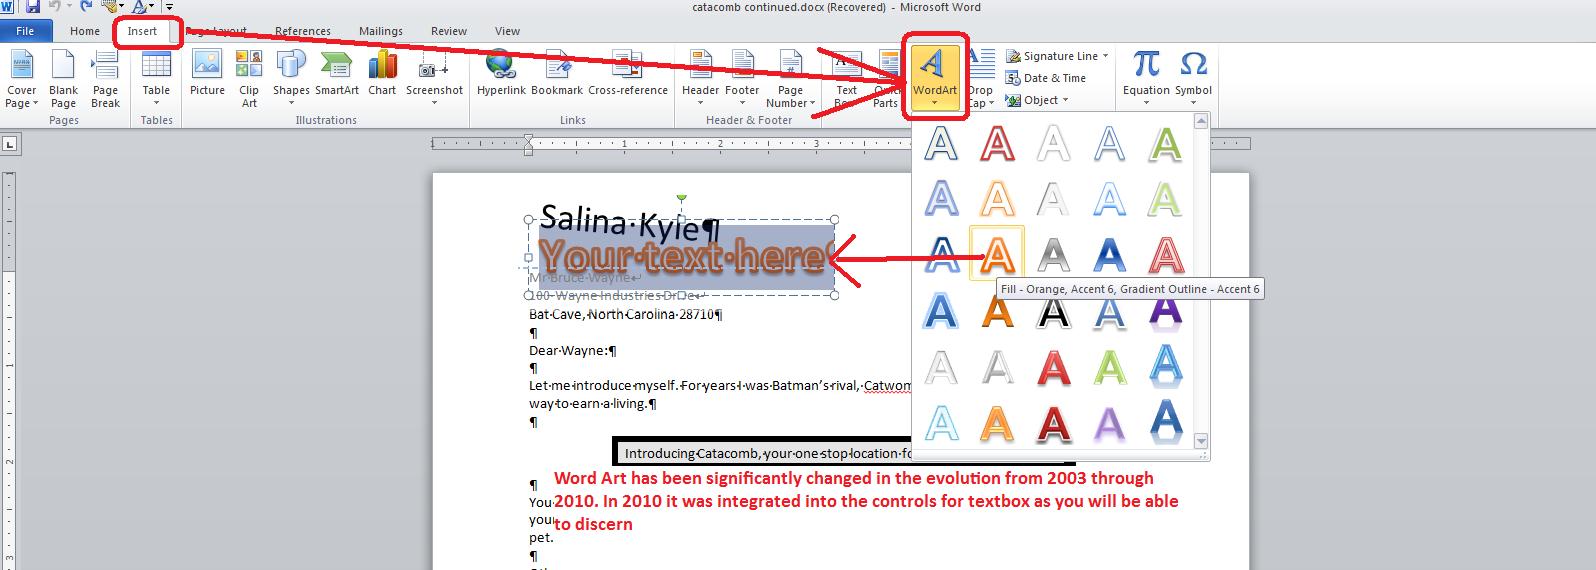

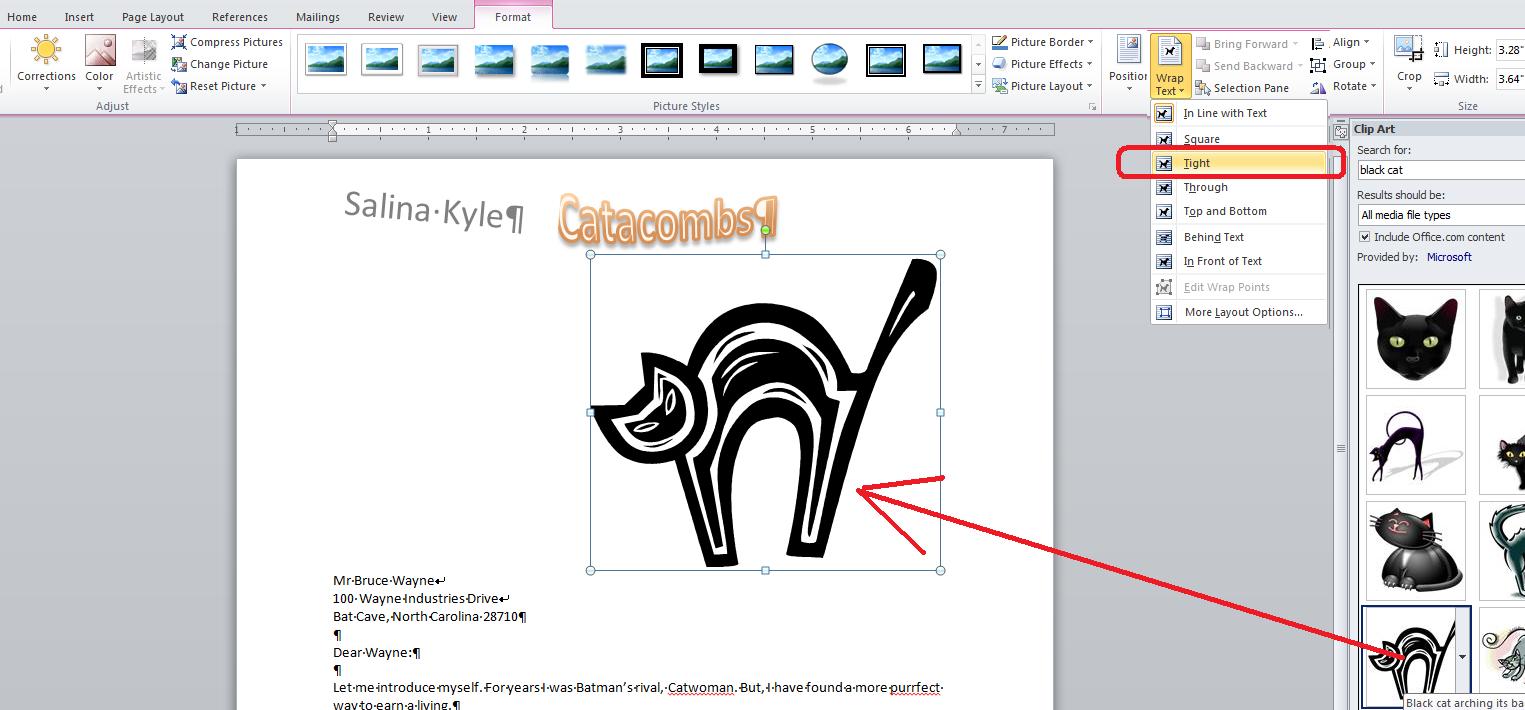
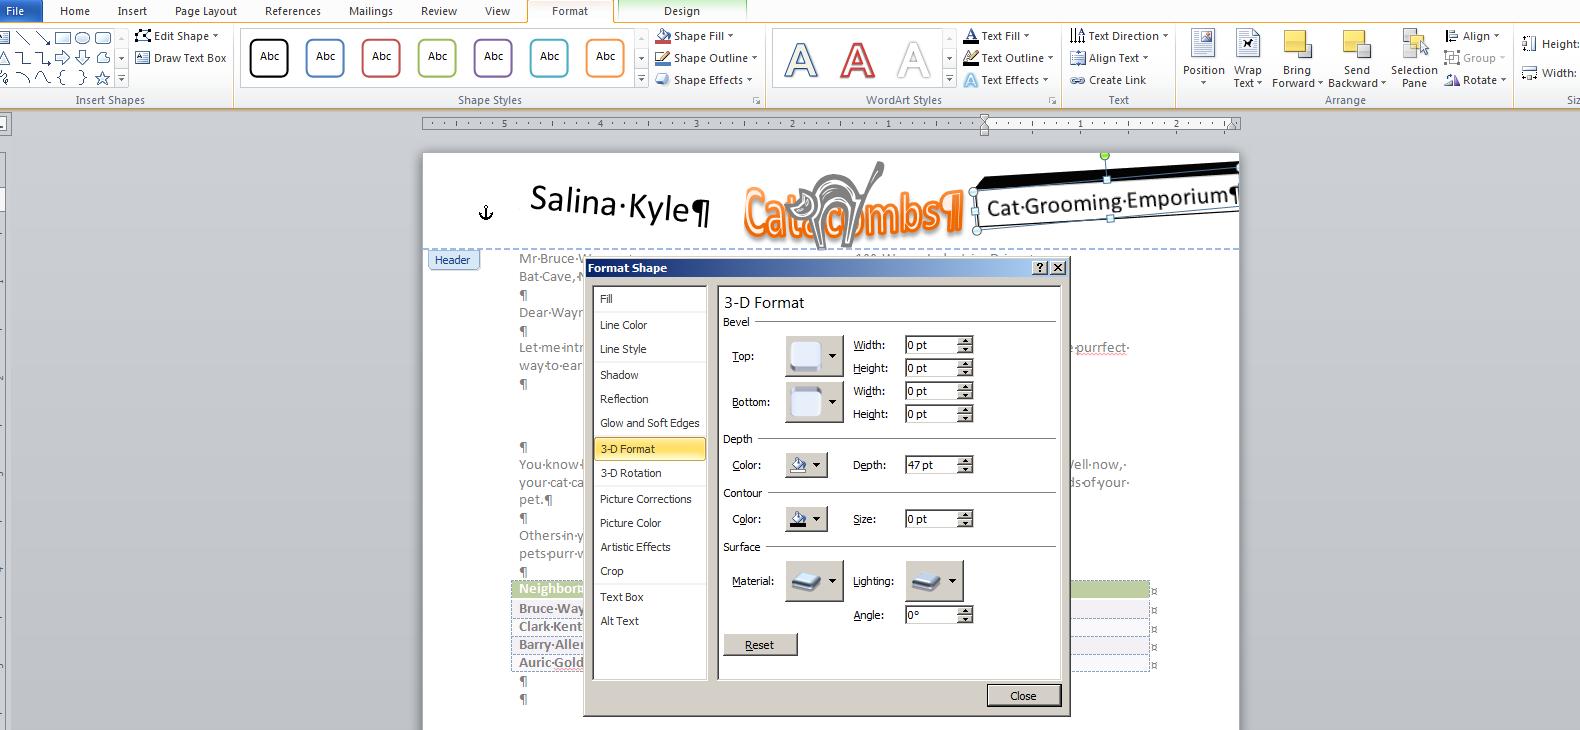
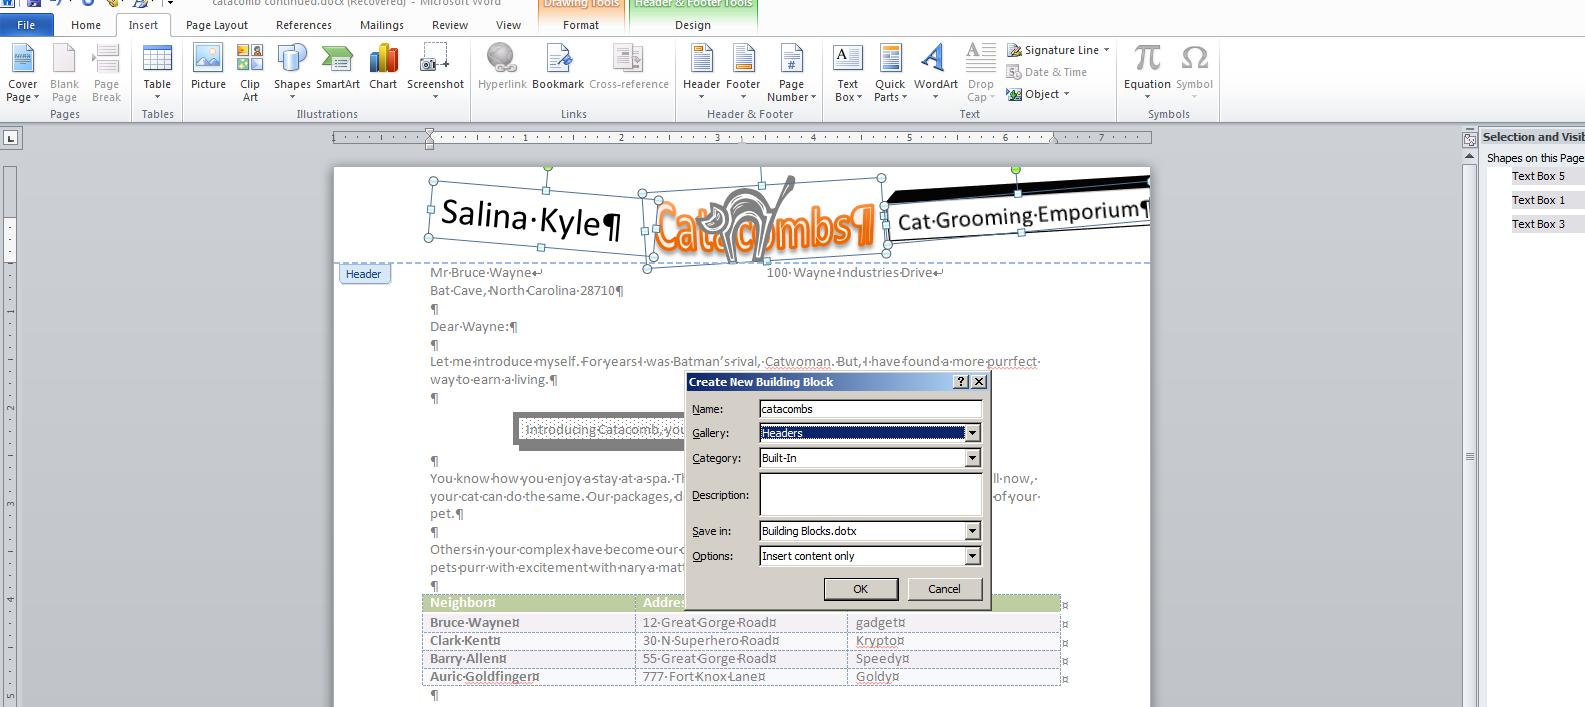
Let's add the picture at the bottom and we get
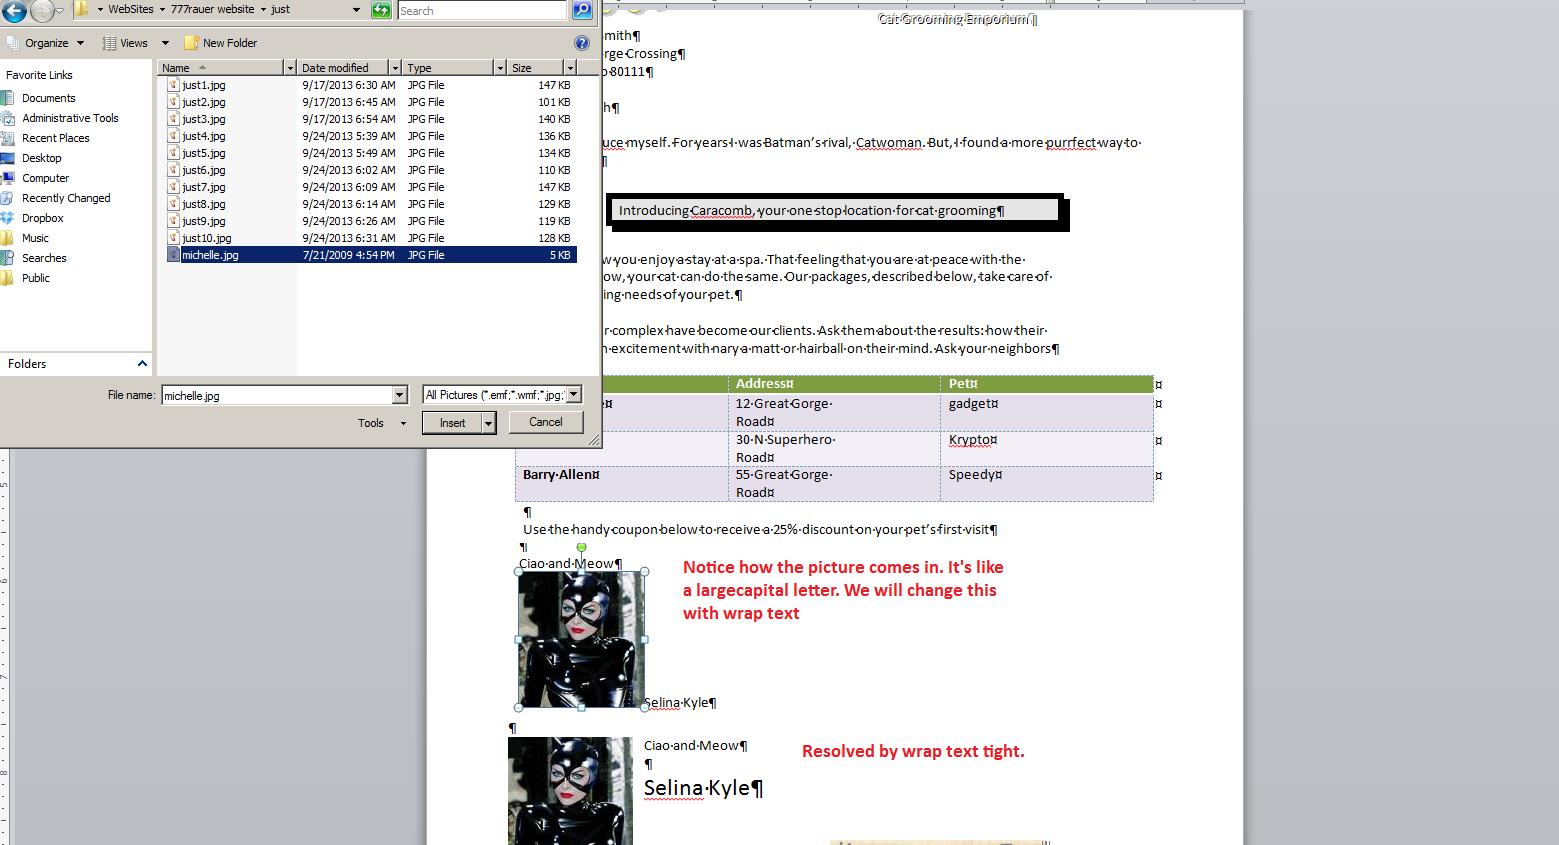
The coupon at the bottom of the page is a textbox using a gradient. Below we select this.
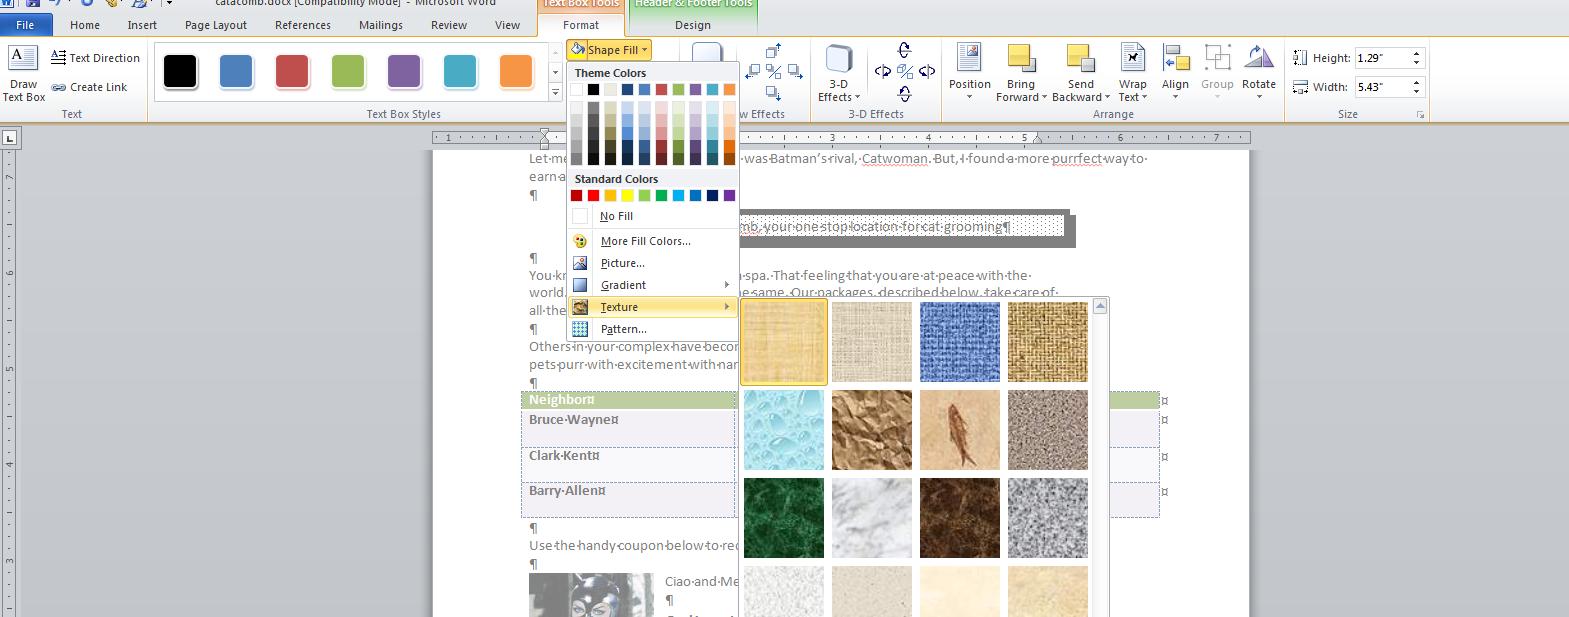
Let's get back to dealing with this document. Suppose we would like to see a different font or point size for this, how and what are we doing. Fonts are styles of characters and the world has plenty of these. You can see these by clicking the top left control in thsi group (it should read calibri) and moving your cursor over several of these selections as was done below. This is preview.
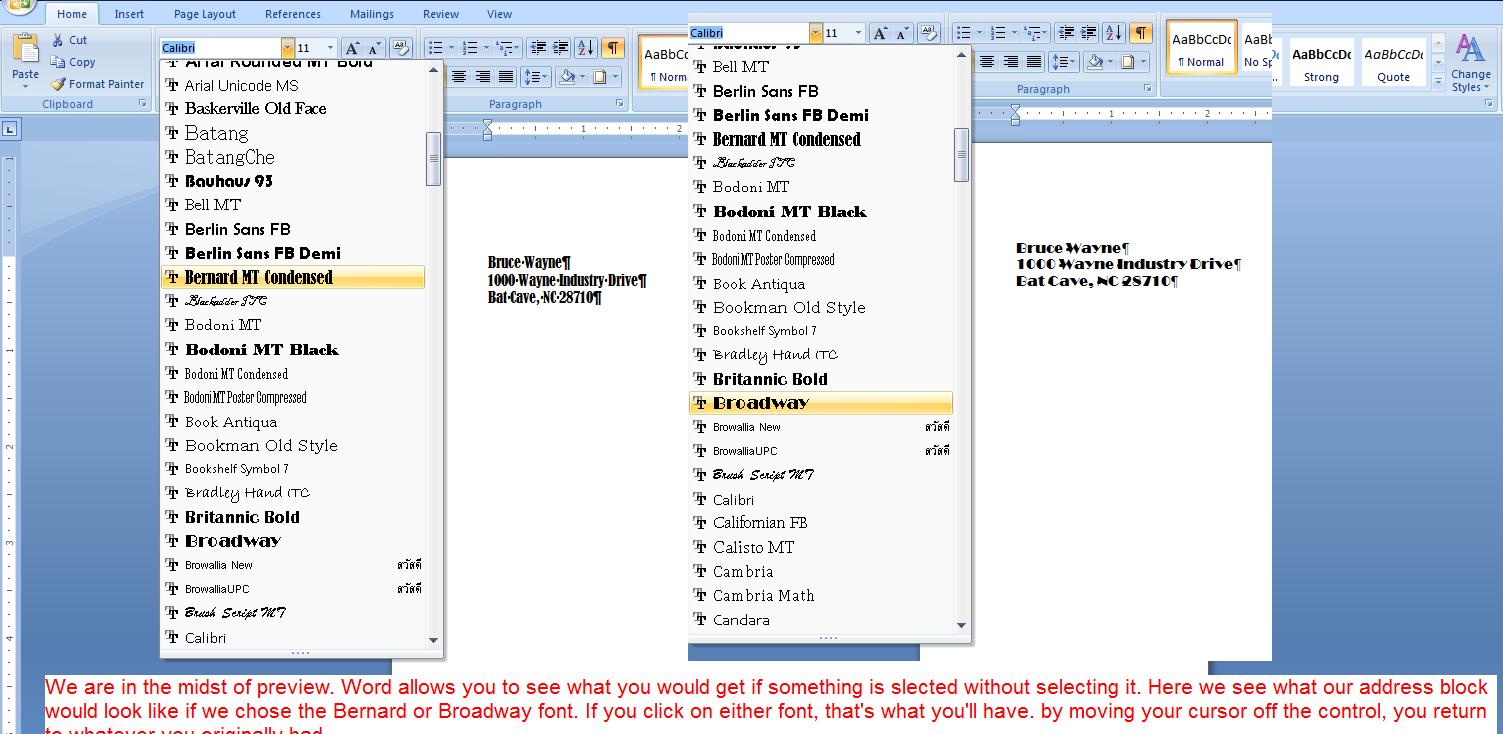
We should mention the use of Calibri. In the 1990 versions of Word the default font was Times Roman, a font created by the Times Of London. Fonts are copyrightable and the use of this font must be paid for. I assume, because of this, the Xp and 2003 versions of Word defaulted to Arial, a font developed by and owned by Microsoft as I understand it. Arial is more open than Timers Roman and probably this is what gave it it's name. Arial 10 was the height of Times Roman 12. For 2007 (and this version) Microsoft has defaulted to Calibri 11, another font owned by Microsoft. Calibri 11 is smaller than Arial 10 (and Times Roman 12).
As to point size, this references the size of the small a in 5terms of the number of periods (dots or points) put on top[ of each other to get to that size. As to displaying point size, it is similar to font and you can preview just as we did for the font. Below, we show this and you should keep in mind that you can preview but without selection the point size will return to what it was before the use of this control
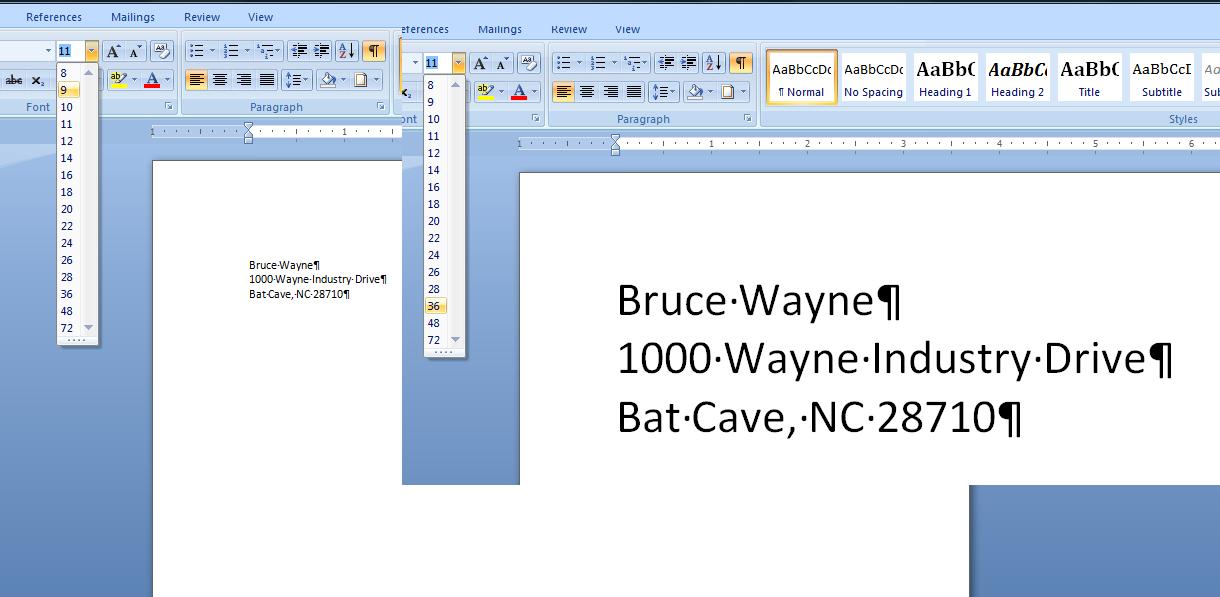
Similarly, you can use preview in terms of underline. The U control in the font group will show a series of underlines when its downward arrow is pressed. Again highlight some text and move your cursor over the possible underlines to see what it will look like. Remember, unless you select, it returns to what it was. Similarly you can do the same thing with colors. In word, there is background and foreground colors,. Foreground id the ink, if you will, and background is the paper. Remeber one rule that every artist knows. A piece of r=text with the same color for background and foreground is invisible,
There are more font controls (and sooner or later we will go over these) but let's concentrate on another aspect of this document now. I need a salutation. After our address block, we want to add Dear Mr Wayne:. This brings up spme problems as to spacing as indicated in the problem in your book. We will discuss several of the possible solutions of your book but understand that we expec t to answer this question with another technique. But first, let's add the salutation. But where?
The traditional way of doing this is to go to the end of the document (the zip code) and hit enter keys as you work your way down the document. In this case, we probably would want to skip a line and then put in the salutation. B ut this version of Word has a better way of doing this. Move your mouse cursor to where you think you would like to add this text beyond the end of the document, Double click and you will find that the system adds blank line (enters, no text) down to your mouse position. In this case, its trivial, but when dealing with a heavy use of objects in addition to text, this technique can save a whole lot of time and trouble. Now, enter the salutation.
After the salutation we need to add another paragraph as indicated below:
Let me introduce myself. For years I was Batman’s rival, Catwoman. But, I have found a more purrfect way to earn a living.
Add this to you document and it should look like the following assuming that we have not changed font, point size, lack of underline and default coloring.
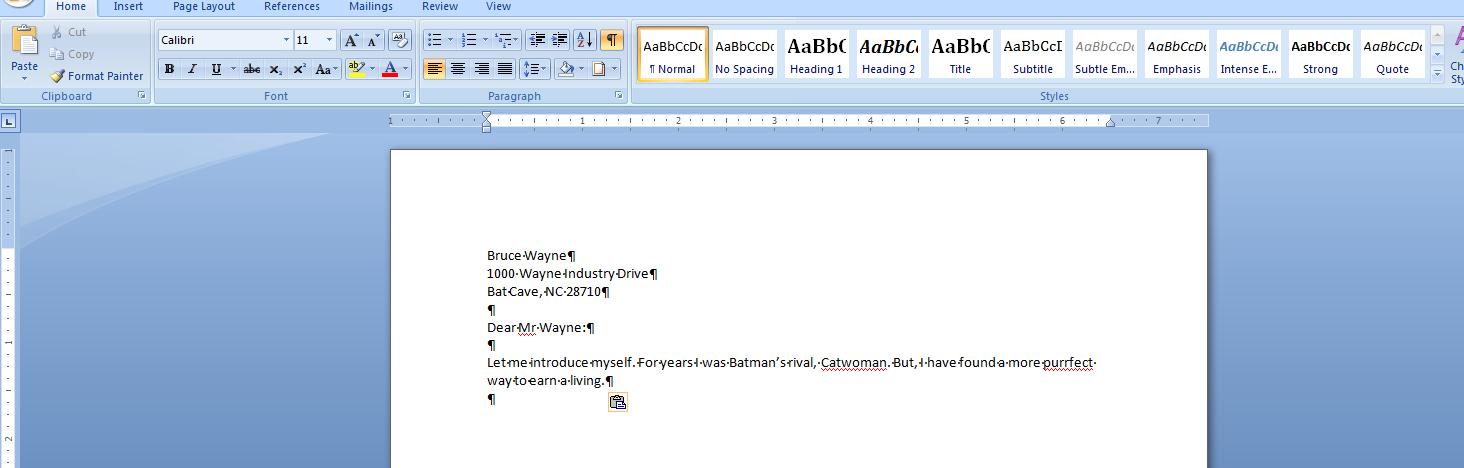
Now, let's discuss this paragraph you put in. Did you specifically create the break between the two lines. We hope not. If you did, you are defeating the entire purpose of this program. The program should have decided when to break based on a whole series of things such as font, point size, margins, etc. The program polls your typing. As you get close to a margin (in this case the right margin) it determines if the word you typed has violated (or encroached) the margin. If it has, it moves that word automatically down the paper to start the next line. We will be discussing spacing and you should understand that what has been defaulted as spacing (or what you have set) determines how far down this next line is. Any changes to any characteristics will force the program to look at your line again. If these new characteristics again have a word encroaching the margin, the line is reset, that word is brought down and it now leads the new line. On the other hand, if added spacing has been created, it will try to fit the first words on the next line up into the end of this line and if it succeeds, the document is completely layed out anew. The word processing industry calls this word wrap.
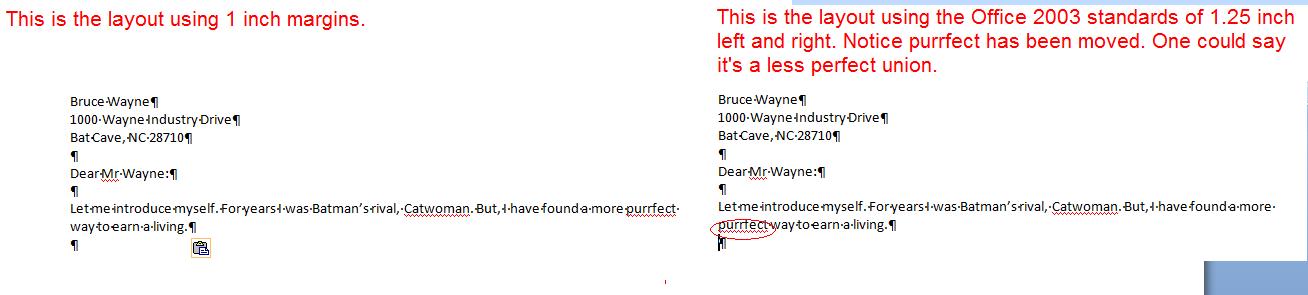
Now, let's look at spacing. There is spacing within the paragraph (between each line). spacing before a paragraph and spacing after. Quite frankly, this is one of the hardest things to control in Word. It is complicated by another factor, the difference in size between the default fonts of 2003 and before and the default font of this and the 2007 version.
Let's take a look at the spacing options. They are part of the paragraph group which should tell you how they can be controlled. Below, is what we would see when this control is pressed. In addition, you can use the dialog box that the group is associated with.
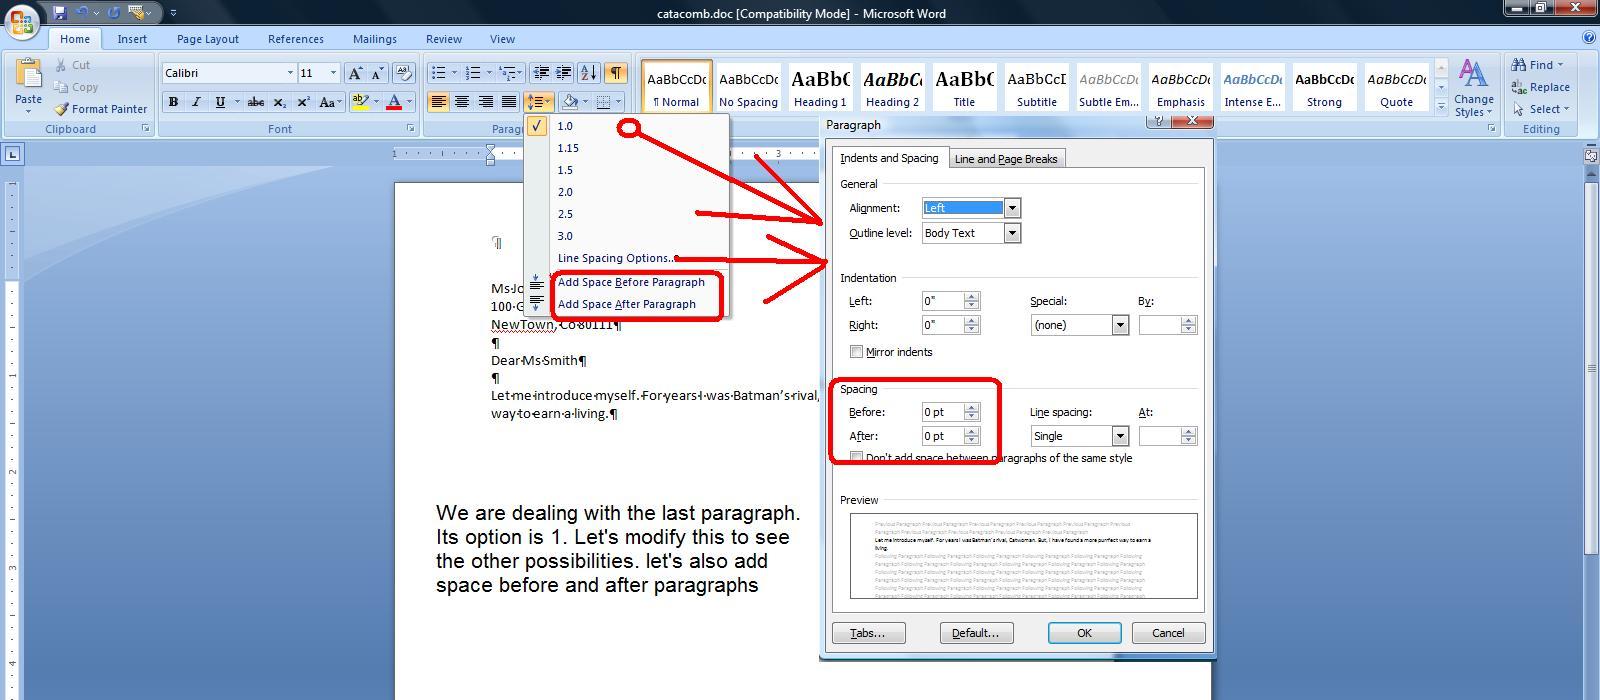
Most of the line options make sense except for 1.15. Can you guess what that might be used for. We'll discuss this in class as we end our lecture
If you look at the entire document, you are now at the paragraph: Introducing Catacomb, your one step location for Cat grooming. But, it certainly doesn't look like the other paragraphs. it is centered, bordered and shaded.
Your instructor has an interest in how one controls the reader's eyes and this is one trick. Human eyes are attracted to darkness surrounded by light. We will do this with this paragraph. It assures that any eyes that are set on this document will at first go here. The plan is to type in the next 2 paragraphs (introducing and you know how), center the introducing paragraph and then border and shade it. To add effect, we will increase the spacing between it and let me introduce and it and you know how.
Let's discuss justification first. But, to see the full effects, let's work on the You know how paragraph as it has several lines. We had a discussion about word wrap and the process of word wrap autimatically creates a jagged line at the right of the paragraph (assuming left justification). Left justification, the assumption that is automatically made, comes from the characteristics of english which is oriented from the top of the page with paragraphs as left as possible. Other languages (and societies) have other norms.
The picture below shows the 3 paragraphs left justified on the left and right justified on the right. The blue line shows the appropriate margin. The green boxes show the remaining space per line for each paragraph. It is the green boxesthat get manipulated during justification. From left justification to right, the boxes are moved from one side to the other. If we were to center, the green boxes would be split with a half on one side and the other half on the other.
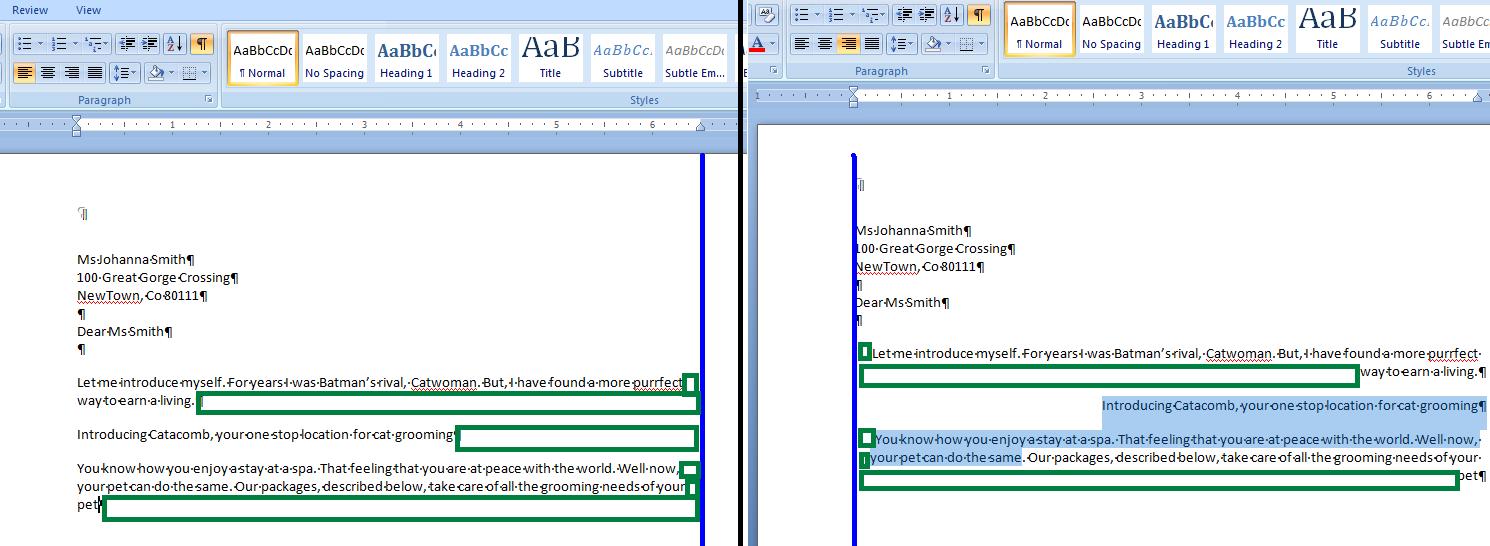
In word, one more justification exits called either justification or full justification. This was made popular by Word perfect in the middle 80's. It is a technique that left justifies while also right justifiying. How can this be done. The green boxes are divided by the number of spaces in the line and added to each of those spaces. This occurs for every line but the last as it would be too obvious in that case. This technique will not work for documents where the average characters per word are high as gaps will be seen. Below, we set these paragraphs to full justification. We have taken the liberty to move lines. At the bottom next to each other is a line form the top paragraph above the bottom paragraph. Look at the spacing indicated by the black lines and circles. You should be able to make out a slight difference in the size of the spacing.
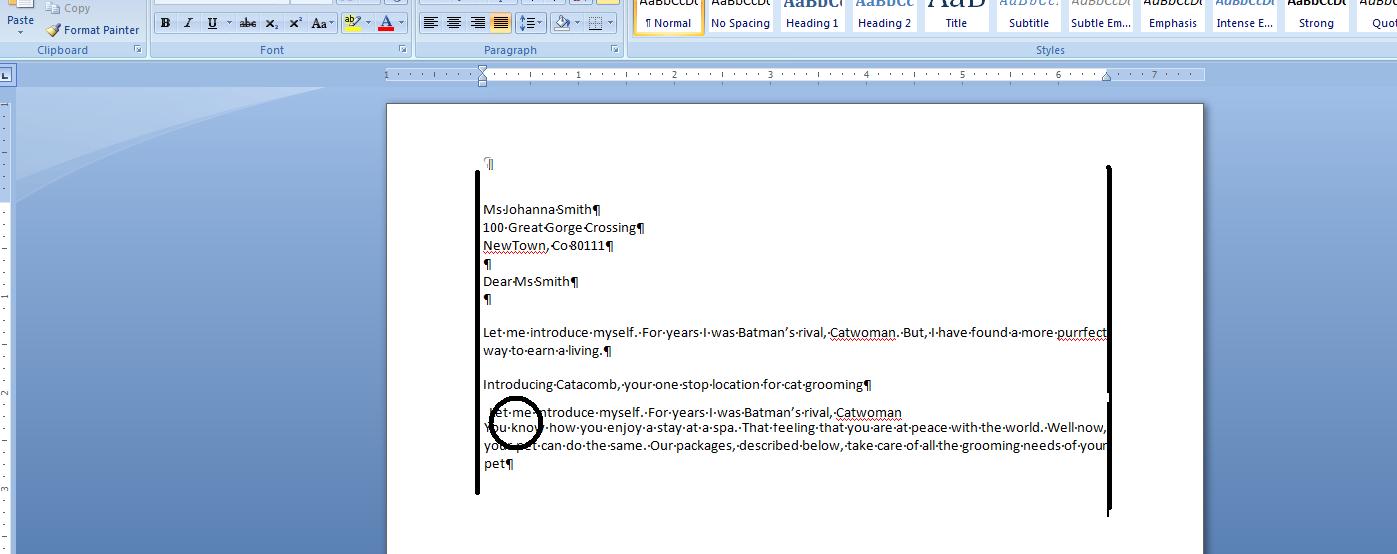
Now having done all this, we would like to center the paragraph starting with introducing. Any changes to the other paragraphs should be undone, You have a tool at the top in the quick access toolbar that is called undo. Another is redo. In word, (and this does not extend to Excel) you can go back and forth pretty much at will. Let's undo the justification changes done to these paragraphs. Below, you can see a composite of what was done. Notice that the undo gives you a detailed listing while redo indicated the next item to redo. The way this works is similar to the use of the navigation keys in browsers in the internet
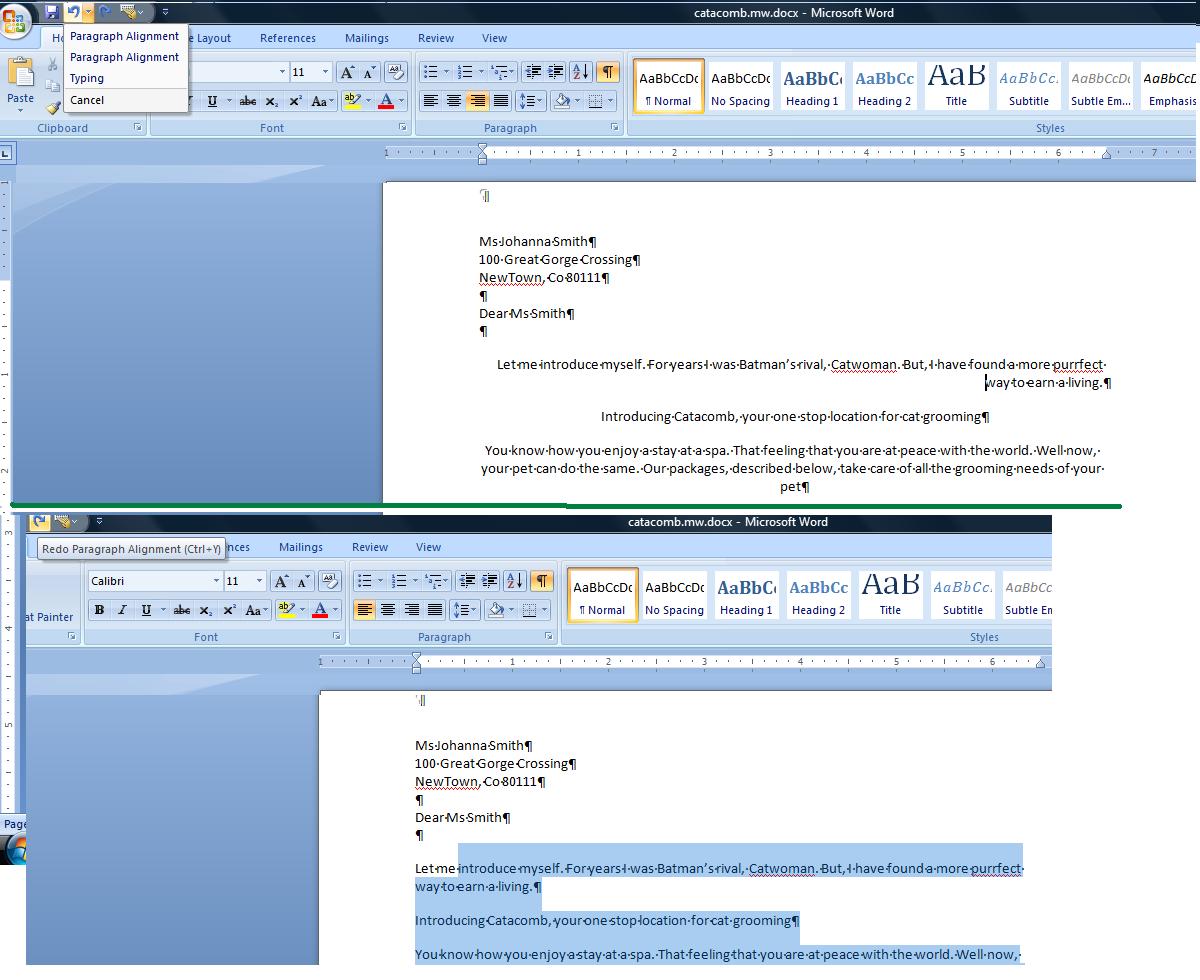
Having done this, let's move to the paragraph starting with introducing. The technique being done could be accomplished with text boxes but we will use paragraph controls. Center this paragraph. Now, move the bottom right control in the paragraph group and click the right portion of the control to see the options. You can see that you can border various parts of the sides of this paragraph. In addition, although we will not use this here, you can set vertical lines which at times is very convenient. We want more, though. Click the last option, Borders and shading and it is here that we will set some aspects of this paragraph.
To the right are various schemes for this bordering. None is an option and disables these borders from being seen. It's the way to turn this off. I normally use shadow, the third scheme for this although you are welcome to experiment. To the right of the type is style color and width. We'll continue with black although feel free to change the color. The style is similar to the underline style we have looked at previously. Choose the first one, a solid line. Width in this case is important. Shadow will not be obvious for width less that 4.5 so click either 4.5 or 6 pts.
You should notice that the preview indicates this shadowing effect. You can deal with each side of the paragraph by clicking it to put it on or off. If you turn on of the sides off, the type of border will be set back to box.
Shading puts a little color (or a gray) into the box You can find this at the shading tab. If using black and white, set fill as no color. In the patterns you will find various possibilities. Ypur audience should determine what percentage to use. If geared to young eyes, head higher. if geared to older eyes, head lower. Keep in mind that your laser printer will probably give you a different effect than what you are seeing. Below, we show a composite of this for you.

Notice that we have the entire line from margin to margin bordered and shaded although the text is centered. To resolve this you can go into the paragraph dialog box and change the paragraph margins or use another technique. First, let's discuss the paragraph margins. This is really dealing with paragraph topography. In many years past, it was common to indent the first line of a paragraph and not space between paragraphs. There is at least one person in this class who learned composition this way. We'll let you decide who is this aged, ancient person among you. As computerization (word processing) made its mark in the 1980's, composition changed. You probably were taught not to indent but to space between paragraphs.
Paragraph topography tries to take this into consideration. Paragraphs are broken down between first lines and all other lines. Firstl ines can be indented or outdented (or as Microsoft calls it, first line and hang). Paragraph margins - called left and right indent - can be applied to all the lines of the paragraph. In the dialog box you see off of the paragraph group are controls to handle all these situations as indicated below.
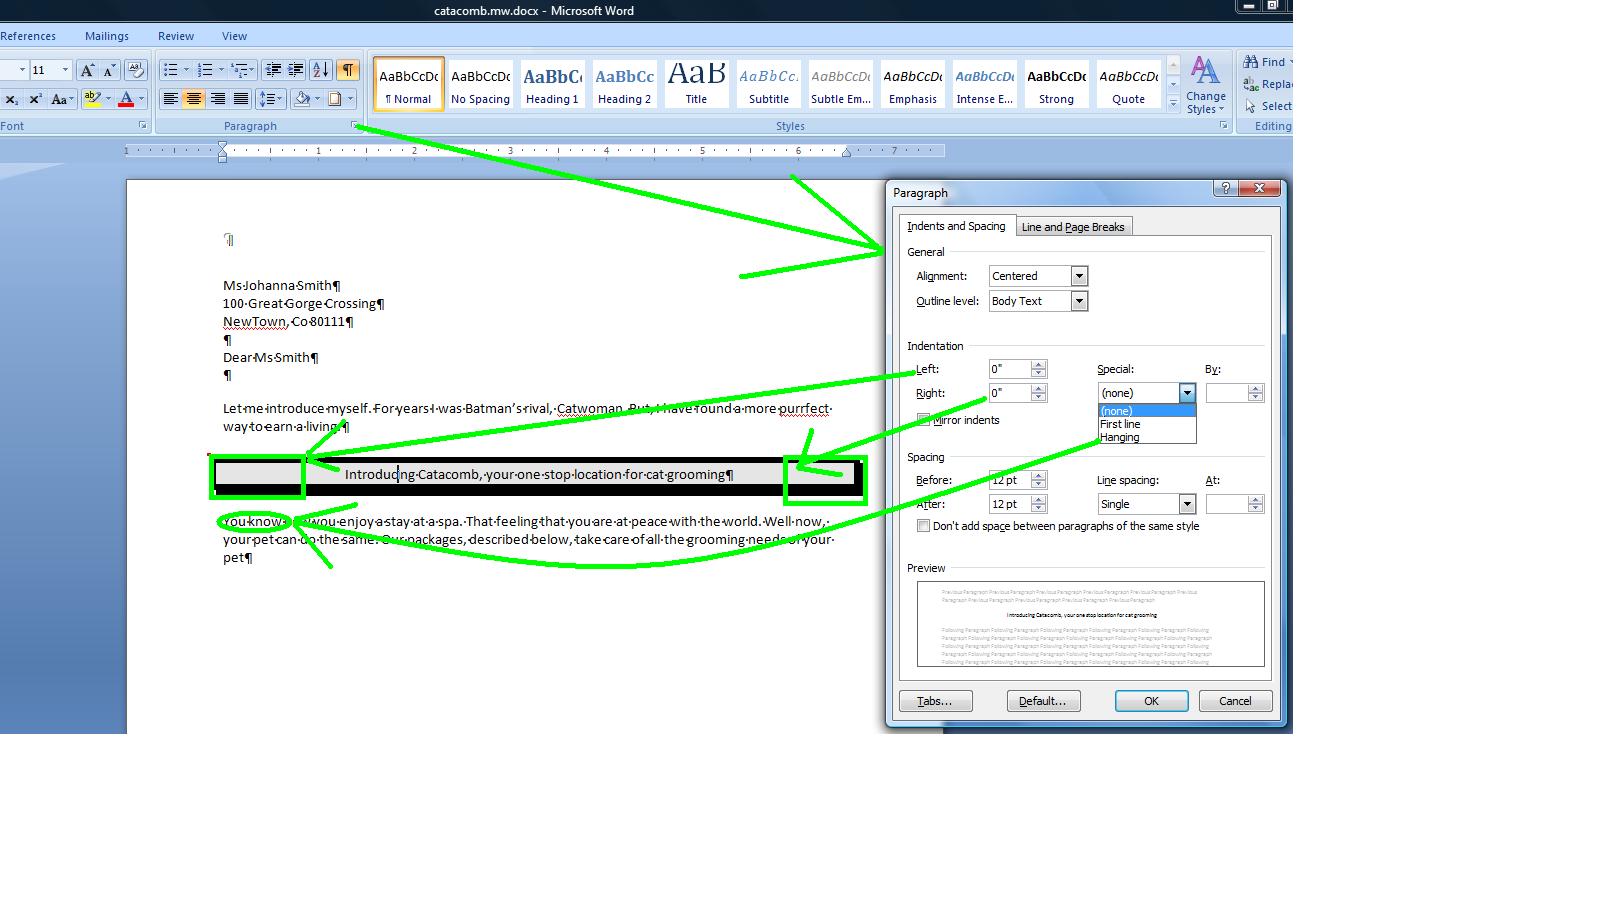
This does seem like overkill to handle this. A better tool exists for this designated as the ruler. Prior to the 2007 version, the ruler was the default. In the 2007 and this version, the ruler starts out hidden. Youi can access the ruler by the control at the right above the right scroll bar or click view and click ruler in the show group. If set on and you get out of the program, the next time Word is launched the ruler will be active. If set off when you get out of the program, the ruler will not show the next time you launch Word.
What does the ruler give you. For any paragraph (or set of paragraphs that are selected) you can control first line or hang, right paragraph margin and the interaction on the left between the first line and the others. Your instructor will show you how this is done on another paragraph and then undo. For the paragraph in question, the omne that is bordered, we need to increase the left and right paragraph margins. Below we see this,
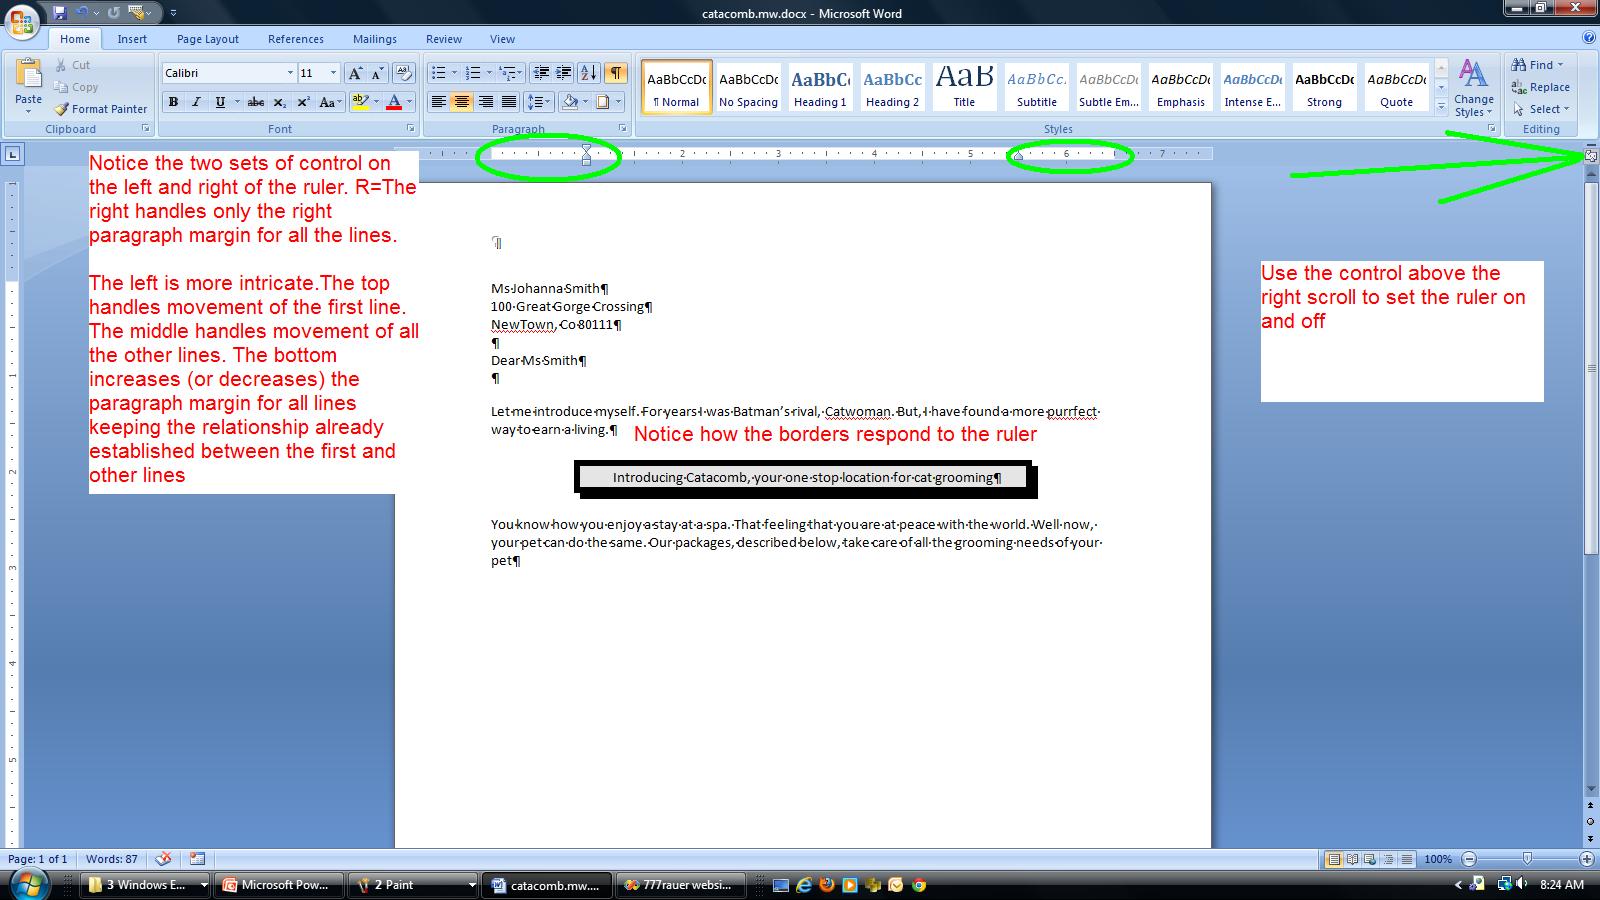
Before heading further down, let's work at the top of the document. Your navigation keys should make some sense now. Use Ctrl Home and you will move to the top of the document in what is designated as the home position of the document. use Ctrl end and you are moving to the end of the document. On any of the paragraphs, use end and you move to the end of that line. Use home and you move back. Sometime in the future we will be using a document that is more extensive and we will have need of page breaks. Move your cursor anywhere in this document and use ctrl enter and you will see a page break created at this point. This is alled a hard page break as you, the user, have created it. Page breaks instituted by the Word program are designated as soft page breaks. By the way, this answers why word wrap points are sometimes designated as soft returns and your enter key is sometimes called a hard return. use your undo to make the page break disappear. Use ctrl home to get to the top of the document.
We want to enter a date as the first line. Hit the enter key to move the address block down further. Now, click the insert tab and click date and time. Dates (and times) can be entered in 2 ways. One is hard wired so that the specific date picked always shows up. The other is by macro, so that the date is picked up from the system and inserted. The update automatically chaeck box handles this for you. The available formats come from the operating system and dates have designation of short, medium and long and you can see this as we have 10/3/11, 10/3/2011,Oct 3, 2011 and Monday, October 3, 2011. Pick the date format you want to show and double click it to insert it. I;ll let you decide whether this is a macro date or specific date.
We would like to handle the header. The 2007 and this version has really changed how Word looks at headers and footers. In a previous class we looked at a predefined header and how it took info from the document properties and used it. Everything is different including how to access the header. You can if you want click the insert tab and then header. It is easier to double click in the header location to invoke this.
When in the header the system helps you with a new tab, the header and footer tool. You can see in this tool a set of control that are of use for the header (and footer). Included are these preset header and footer objects. Date is included as is page number although both of these (you are already aware of date) are in the insert tab options. Access to pictures and clip are also are allowed although again you can use the insert tab of the ribbon for this. Notice that you can also clase the header and this bring you back to the document although it is easier to just double click within the body of the document.
In the Aspen Fall problem, there is a use of clip art in the body of the document. we are going to do the same but just place it into the header instead. We are going to complicate this procedure by intermingling the clip art with word art.
Now, what is word art. It is a cariculture of letters. Below, we track the process of putting a Wrord art object indicating catacomb into the header.
Not shown here is the invokation of an additional tab, designated as Word art tools. If on the word art object, word art tools will show up. if on the header, the header footer tools tab is in operation. Now, on the word art tools, let's look at this. You can space out or compress the letters. You can change the style. In addition you can change the color of the inside (known as a fill) and the outside (known as the border) of the characters. You can even change thei ntrinsic shape of the style although this style was chosen as it looks like a cat as it scratches (you have to be a cat lover to understand this). take a look at text wrapping. When we study picture we will delve into this and positioning more fully but for now, click text wrapping and choose tight. This will move the object somewhat. Move your cursor over calacomb and look for a 4 pointed arrow and when you see it, move the object with your mouse as the left button is depressed. Below, we have put this into position.
Now, back to the header footer tab. Click clip art and a panal will open to your right. Let;s find a cat and so enter cats as the search for. Nothing is more beautiful that jet black cats (in their opinion also) so let's look for a Halloween cat and you can see that I have selected this in the screen shot below.
All right. Similar to the previous object, you have a new tab associated with this clip art (although it will probably say picture). Enter the tab and move to wrap text and set this to tight. Now, move your cursor above one of the four handles at each ofg the corners. You should see a 45% grabber. Move this in till the cat is an eighth of the original size. Move your cursor over the cat un til you see a 4 cornered arrow. Depress your left button of the mouse and move the cat so that it straddles the second C of catacomb as indicated below.
I hope to get to this point in these classes today. If so, we;re done for the day. You can save this if you would like to your flash memory but at our next class there will be a link to load it at that point.
At the end of our work with Catacombs, we will be dealing with a much longer document. I have several to choose from, but in Fall'12, I used a new document at that time and I think this term we will use this also. You can access this document as we left it last week by clicking here.. For Thursday, Oct 10th, you can access the document as we left it on Oct 8th by clicking here.
The document pertains to a book that I started to read in 2011 about a famous British (originally from Hungary) architect, Enro Goldfinger. I found Goldfinger to be an interesting name per some of my other interests. One is my new (now more than a year old) gold Prius. It is named for another Goldfinger, although fictional, named Auric Goldfinger. Since Enro, Auric and my Prius are involved in this, I have titled this document, 'All Things Goldfinger'.
I can also point you to some other sources pertaining to the name Goldfinger. click here for a trip to Canada starring Auric Goldfinger, the car. And, you can click here for a discussion of Auric Goldfinger (and Erno, too, for that matter) and the year, 1964. Let's access our document and discuss navigation in large documents. We can access this file by clicking here.

Your laser printer doesn't care, quite frankly. It is designed to provide printing services way in excess to the two options that Word provides. Your laser can in essence print pages at any degree, not just the 0 and 90 degrees indicated here
Once we set portrait, we need to correct margins. In the olden days, using typewriters. it wasn't unusual to have margins like this. Today, the norm is 1 inch around (or 1.25,1.25,1,1 in prior to 2007). Below, you can see the differences as we change margins including the number of pages.
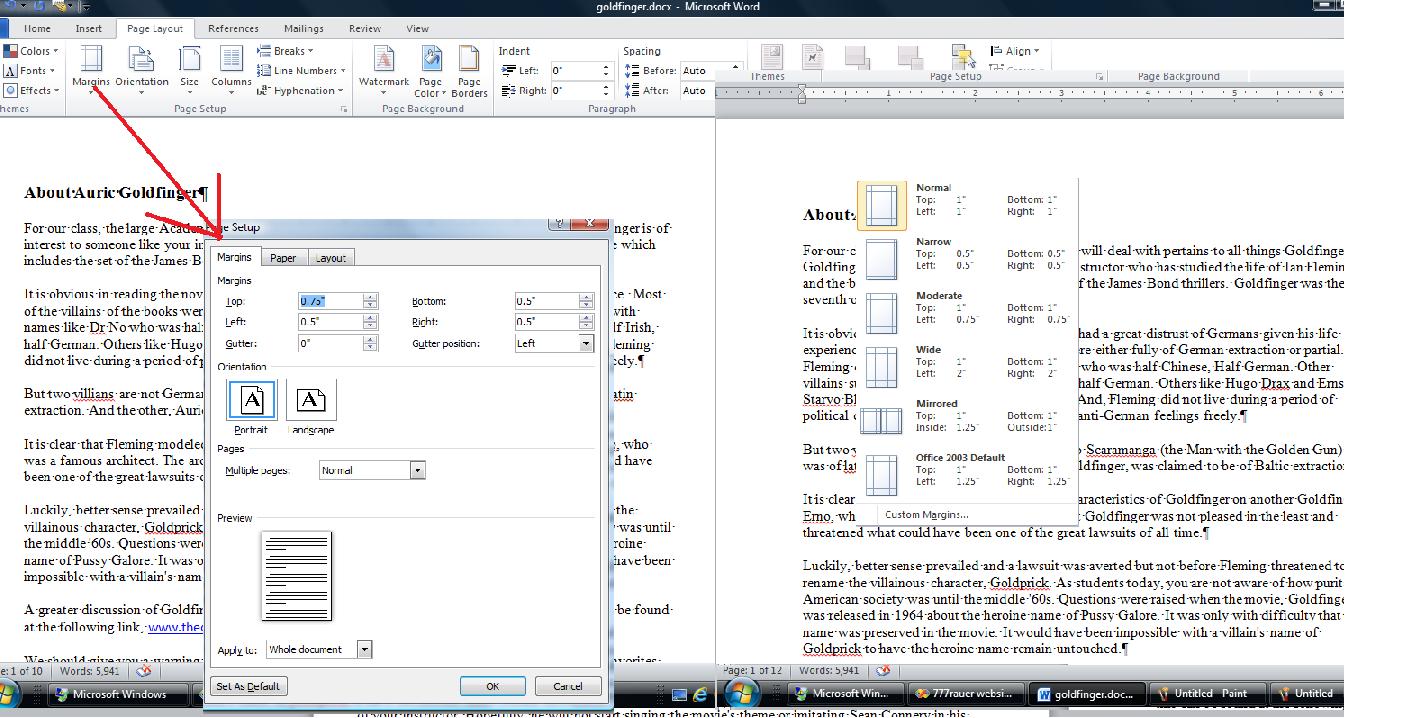
With 12 pages. we need a way to navigate through the document. The easiest way is through ctrl home and ctrl end. The scroll bar moves you sequentially through the document How about going directly somewhere. This breaks down into goto or bookmark. Goto is found on the find/replace/goto dialog box accessible in several ways. Once on here, you can navigate this document using page no, line no, etc. Use of + or - increments your movement. Below is an example of this.
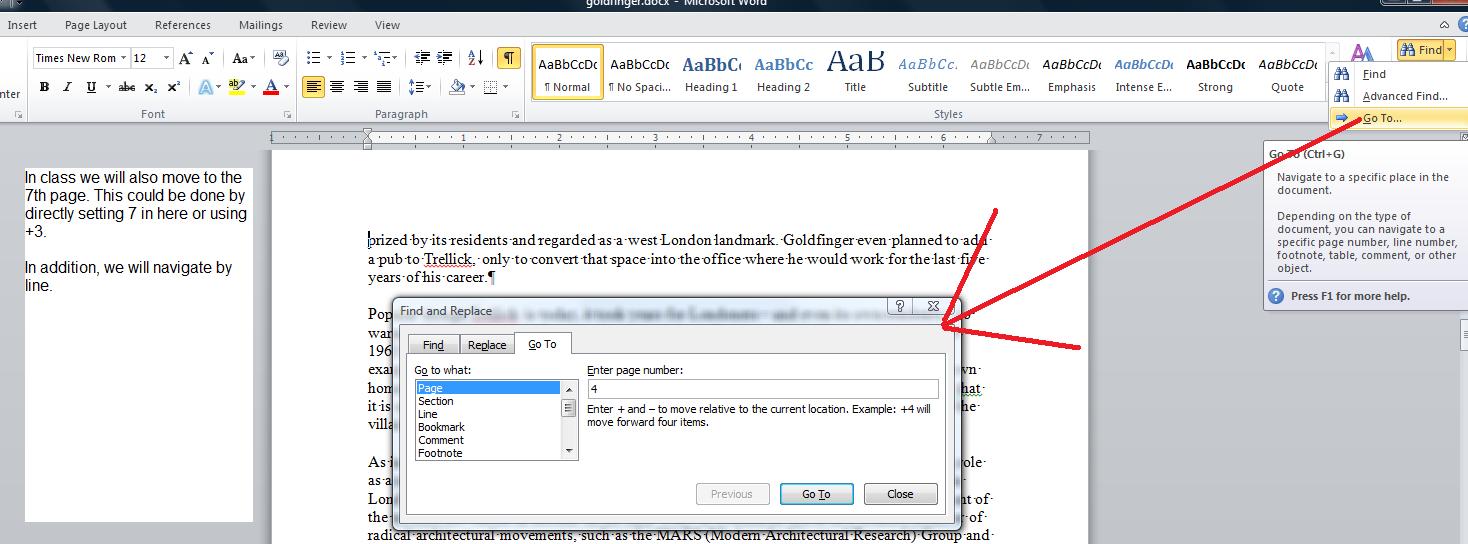
Another way of movement would be by direct gotos to an area. This is a bookmark which we will demonstrate in class. Hit ctrl end and move to the end of the document. Let's assume that we will be doing more research on prious' and Toyota. Let's set a bookmark at the end of page 10 designated prius so that once we have our info, we can add to this document. Below, we show the two ways to access this bookmark.
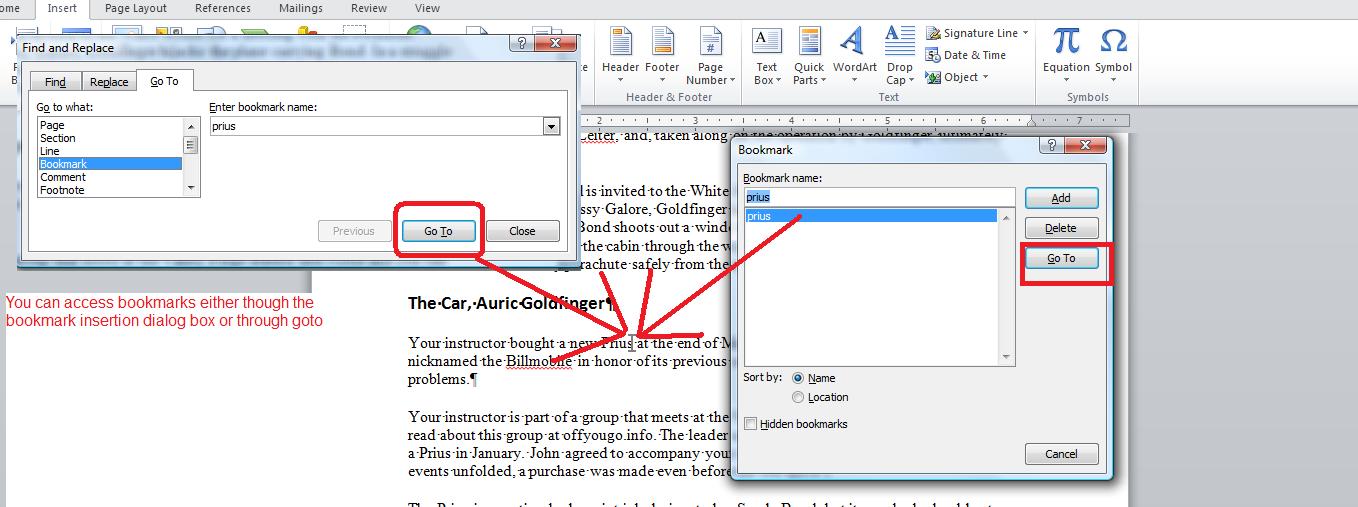
A more modern way of navigation is through find. THis has changed since 2007 with a type of internet search built in. Thge locations of the text are displayed in the panel to the left and clicks bring you to the text.

We need to add a hyperlink and we will modify the document properties as indicated in the picture below.

You will notice that Word is defaulted to represent what it thinks is spelling mistakes in jagged red lines and grammar mistakes in jagged green lines. THis comes out of the dictionary that is a part of Microsoft office. You can modify this by adding entries into a custom dictionary which we will do. Obviously with a document that claims to cover all things Goldfinger, the word Goldfinger appears quite often and with a jagged red line associated with it. Let's add the word, Goldfinger, to the custom dictionary and see what happens. This is indicated below.

Let's ask the system to recheck the spelling and we should have cleared Goldfinger from assumed misspellings.
There are two ways to deal with misspellings. One is through the spell checker but another option is autocorrect. let's deal with the spellchecker first.
Generally, you run this using the entire document. Each word is checked per the system and custom dictionary. And, the system uses an algorithm to give you alternatives in case of a word not found. Ypu can take such a word and add it to the custom dictionary while in this process if you like. Or, you have options to have the system ignore this misspelling for the duration of the document. Since this document is influenced by British english, we should see multiple misspelling based on the differences between American and British English and, of course, proper names will also show up as misspellings. When I ran the spell checker (off of the review tab), the rfirst error I got pertained to a common abrev for Doctor. The Dr was flagged as an error. I inserted a dot after Dr and asked for change and went onto the next error. The name Drax is not so easily fixed given that it is a proper name. I could add it to the custom dictionary but it is easier to ignore it throughout the document. I am also offered possible corrections. We can see this below.
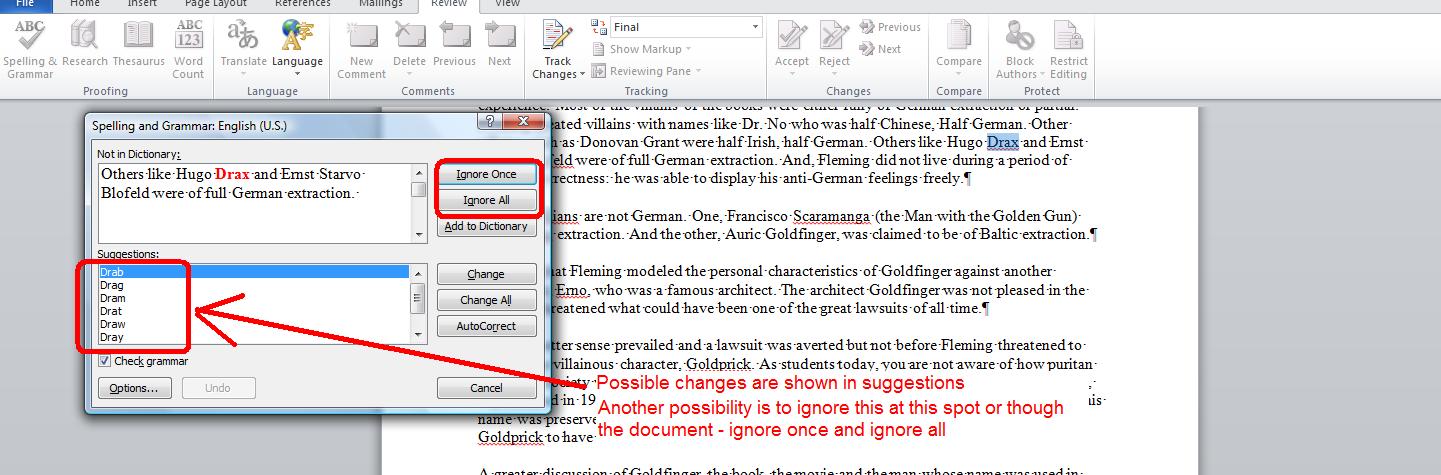
We will run though a series of pages on this which is somewhat tedious. I want to get to a green jagged line and we start to see rthis by page 4. Grammar is dealt with by rules and you can see this at that point.
Now, I have a question for you. How good is the grammar checker? IBM first, and then Microsoft have been working on this as are other vendors since the early '90s. The spell checker goes back into the '80s in Word Perfect. I believe the grammar chacker makes its appearance in 1994. But how good is it. Let's see by use of another word document. Click here to load a word document I call spell. Beside dealing with the spell and grammar checker, this is the first time we are using something called multiple document interface which allows Word to handle more than one document at a time.
What can you say about the spell checker/grammar checker using this document?
I want to modify the goldfinger document at the bottom. We'd like to add "at the end of Febuary" after transmission problems. But, you'll notice that we have misspelled the name of the month. This is a common mispelling for me and I can correct for this using autocorrect as indicated below.
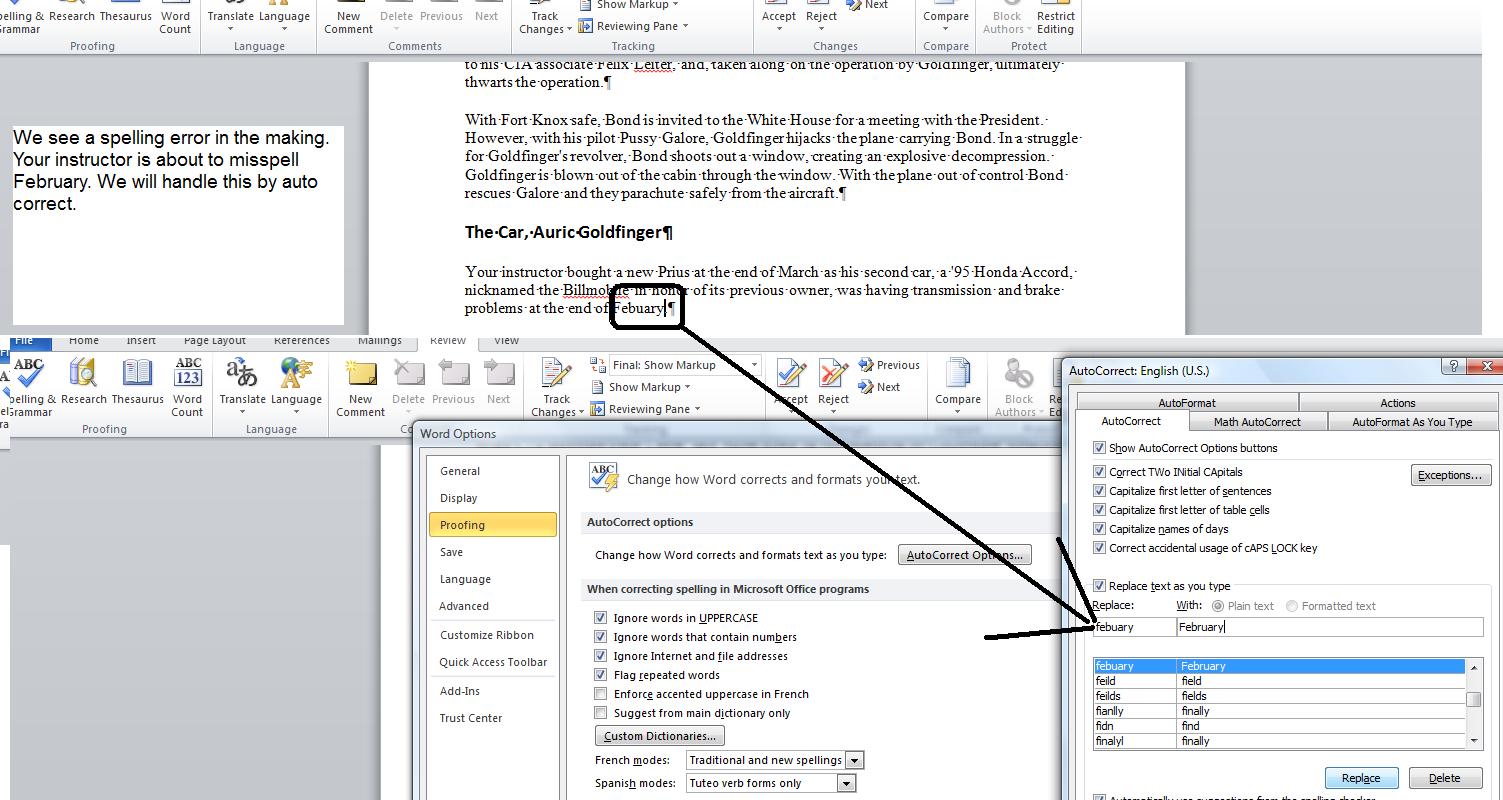
We would like to add some pictures into this document. Here are the pictures listed below. Put them in your picture library.


We are going to load up Ian Fleming.jpg on page one. Remember this is brought up in line with text. Let's use position to place the document as indicated below.

Once our pictures are placed, we want to add in captions. After our captions we will do a table of figures.
Let's insert footnotes and convert these to endnotes. Footnotes are another way of citing references although they are most used for allowing an easier read of a document. Find the first instance of Crosse [&] Blackwell. Let's indicate in a footnote that this is a division of J.M. Smucker.
U\You can convert footnotes to endnotes. Endnotes are nothing more than footnotes that are placed at the end of the document. To start this process, move your cursor over any footnote and click your right button and select note options.

Below, we show the end notes as they are placed. Notice that footnotes are numbered, endnotes are numbered by roman numerals.

Let's work on text boxes. There are several ways to do this. In the catacomb problem we did traditional textboxes. There are two other ways that we can experiment with. One is a pulled quote which creates a text box around a selected text. We do it and then undo it. Another is a textbox template as found in the list of textboxes. let's do one that changes the direction of the text. Below we see the selection.
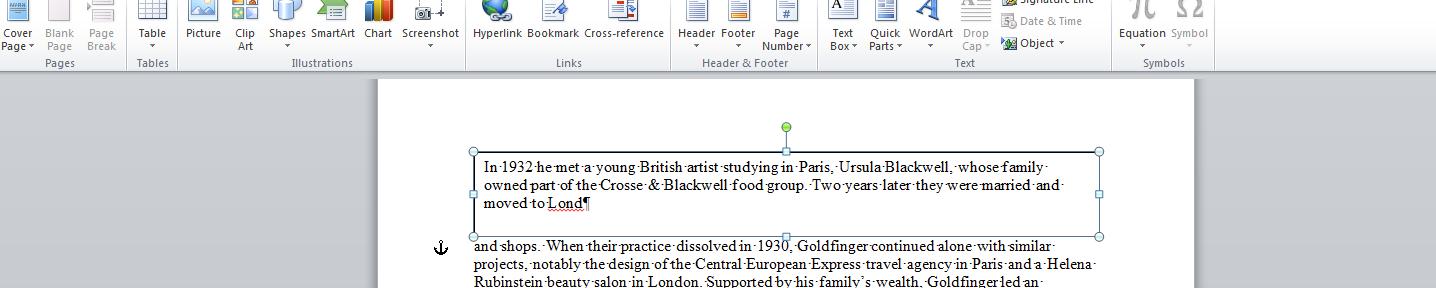
In the template created, copy in the text
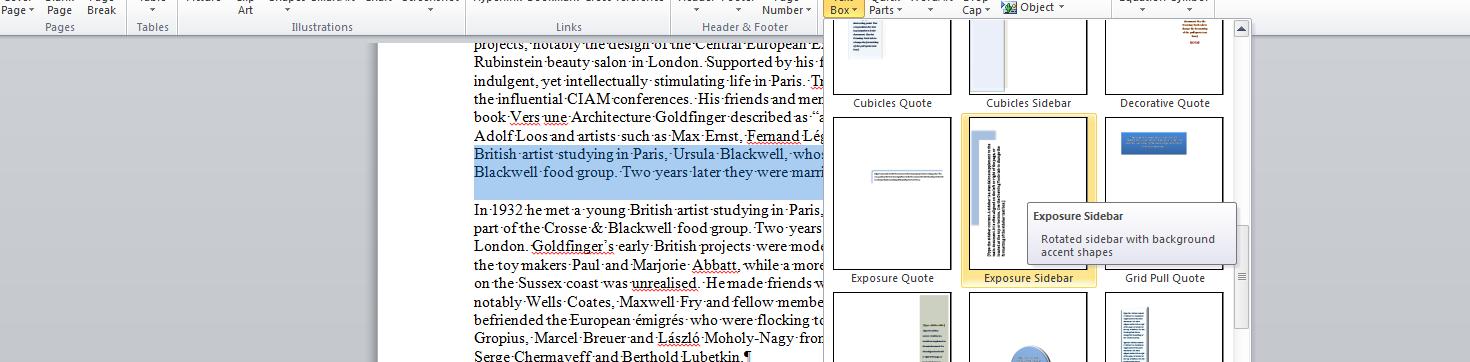
Let's look at the use of headers. Again, we will use the templates. Let's deal with austere. This shoukd pick up some of our properties. Once done, and with a few more modifications to the document, we will try to create first, odd and even headers and footers.

Now, Let's do a table of contents. The paragraphs set in 14 points would be perfect for this. Microsoft has changed the way table of contents are set and created with almost every new version of word. This version seems to go back to the 2001 style. Those paragraphs with heading 1 seem to be chapter headings, heading 2 sets sub shapter headings. Let's set these.
To invoke the table of contents, create a new first page and place your cursor in this first page using ctrl home, ctrl enter; ctrl home. In references, click table of contents.
On all these tables that we create, keep in mind the user must refresh when pages change.
Let's set a table of index. I will show you how in class using mark index on the references page. In do this we will have two dialog boxes in action at the same time and communicating with each other.
One other table to consider is the citations. We will cite my article on the diskcoordinator, Goldfinger the book written by Ian Fleming in 1959, published by Jonathon Cape and the book by Nigel Warburton published in 2003 by Routledge Press of London titled Enro Goldfinger: The life of an architect.
Not shown on our final goldfinger document for today is cover pages and hopefully we can look at this at the end of class.
I have added a list of the Fleming books. Highlight the list. click on bullet. This is the generic bullet. You could also number. Click on the command next to the bullet command. Now you see generic numbers. Bullets and numbers can be enhanced. Notice the added conrtrol to the right of the command. Clicking this gives more options.
What if we would like to place a picture as a bullet. Click here for a suitable picture.
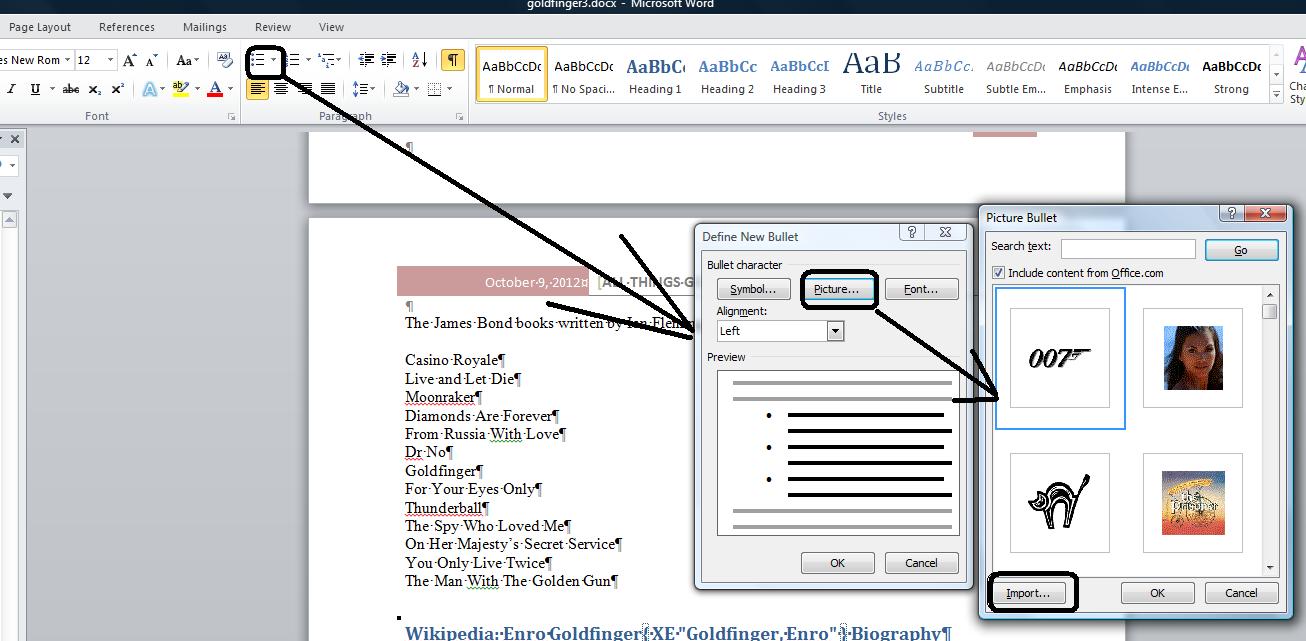
While we are dealing with paragraphs, lets look at the indent button. This moves each line of a paragraph in a half inch. Use the outdent button to bring the lines back. We'll show this in class.
Your instructor is interested in breaking up documents intuitively per the user. Another possibility is drop cap. This creates a letter that is several times larger than normal placed at the beginning of a paragraph.

Let's look at a cover page. THis is new to Word 2007. It picks up a lot of the meta data in the properties section. Cover pages is a set of templates in quick parts. Since we have used austere in headers and footers, let's use Austere for a cover page template. You can select it as shown below.
Let's set a watermark. Watermarks used to be physical indents on paper but those days are long gone. We can set a watermark either horizontally or diagonally. Let's put in the verbiage "For educational purposes only". Watermark is an example of z-order and transparancy.
Let's look at several options per the review tab. You can see the comment group. Comments are messages to readers and are not printed. Below, we set a comment about the use of the word thrillers. This comment is displayed as a balloon.

Used for the test:
rating
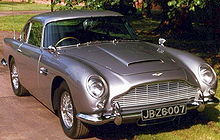
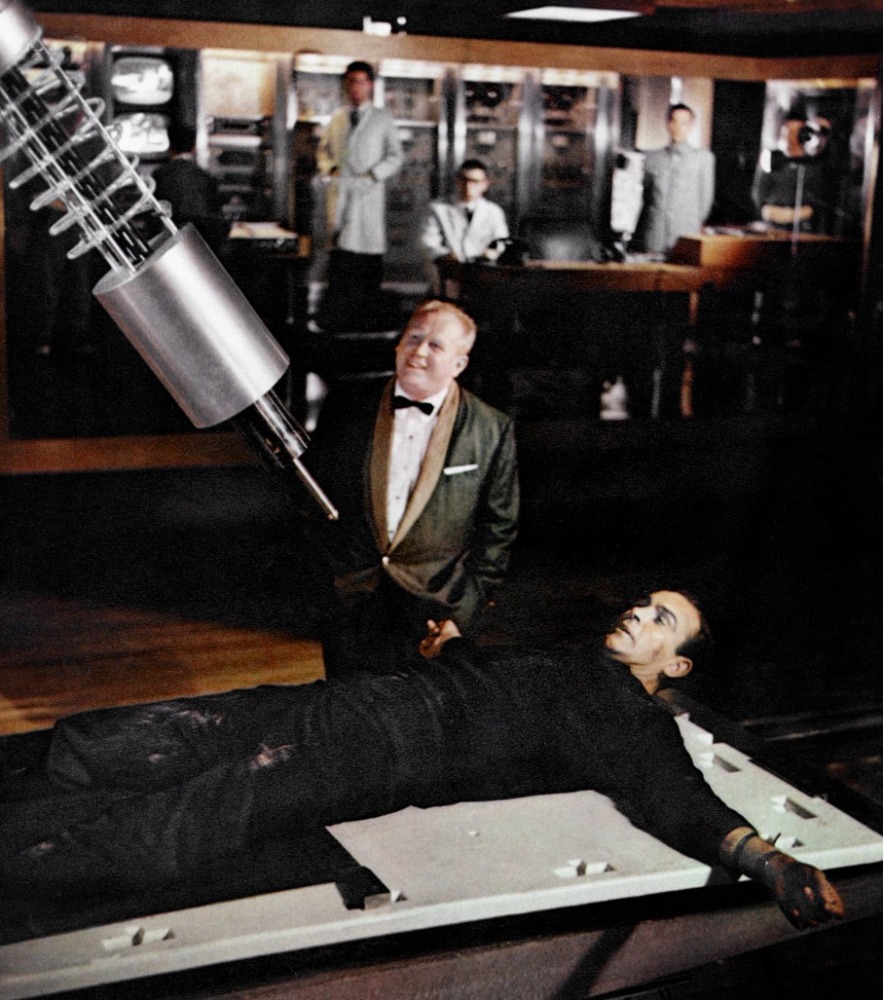